Four Signs Indicate Complete Recovery of Bitcoin's Bullish Momentum
Despite a recent minor pullback of about 2.5% from the multi-month high of $82,800 set on May 6th, market analysts believe the upward trend remains intact.
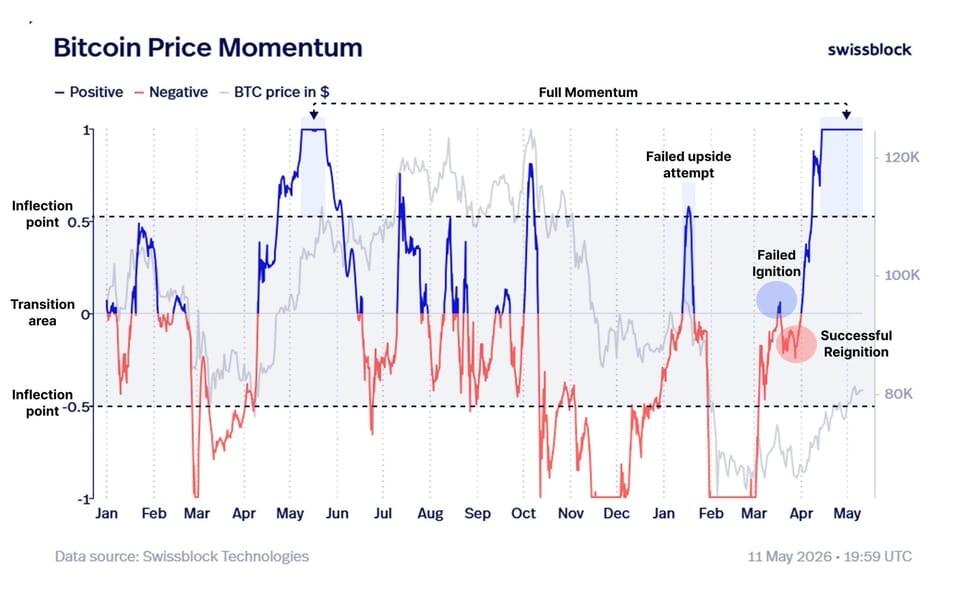
Private wealth management firm Swissblock stated that Bitcoin "is still in a state of full momentum," with the latest round of increases having "successfully reignited and push[ed] the price momentum back into a fully expanded range." Currently, Bitcoin is consolidating within the key cost basis area near $80,000, where the true market mean and short-term holder cost basis provide support, and the active realized price of $85,000 forms resistance. Swissblock added, "As long as the momentum stays above the transition zone, the bulls remain in control of the market."
Analyst The Great Mattsby also pointed out that Bitcoin's bull market support belt has turned back to support, with the 21-week Exponential Moving Average (EMA) crossing back above the 20-week Simple Moving Average (SMA), "the trend has officially switched back to bullish."
Stablecoin liquidity returns, signaling a "strong recovery"
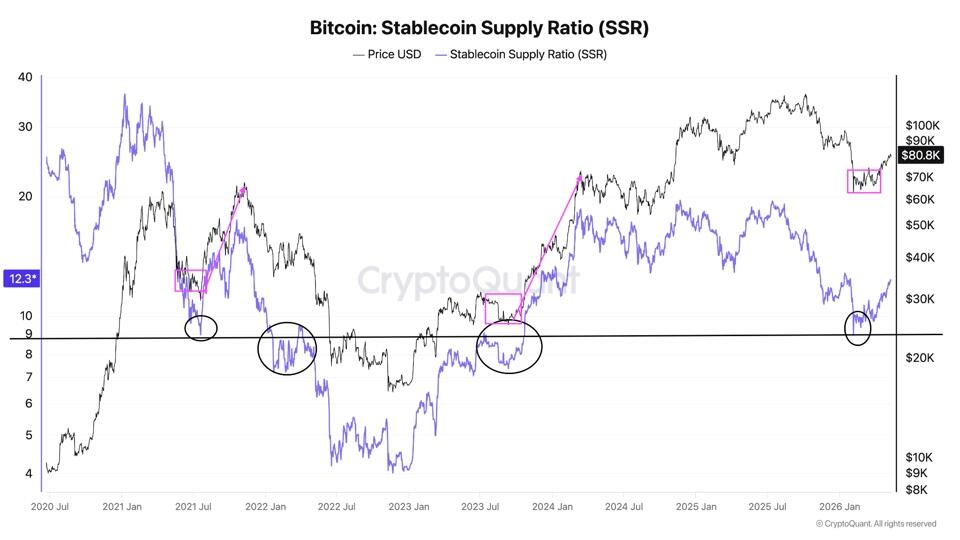
The Stablecoin Supply Ratio (SSR) has rebounded from historical low ranges (below 10), which previously marked market bottoms in mid-2021, 2022, and mid-2023. Each time it rebounded from that low, Bitcoin broke out of the range and launched a strong rebound.
The Binance Stablecoin Supply Ratio oscillator also confirmed this judgment, with Bitcoin's 90-day SSR oscillator returning to a positive range, reaching a 12-month high of 2.8. CryptoQuant analyst Zizcrypto said, "This reflects the significant activity in stablecoin purchase demand during this rebound, recovering strongly from the negative value area." He also noted that the indicator previously reached 2.43 in May 2025 and 4.00 in November 2024, both in stronger market phases.
Network activity hits 20-month high
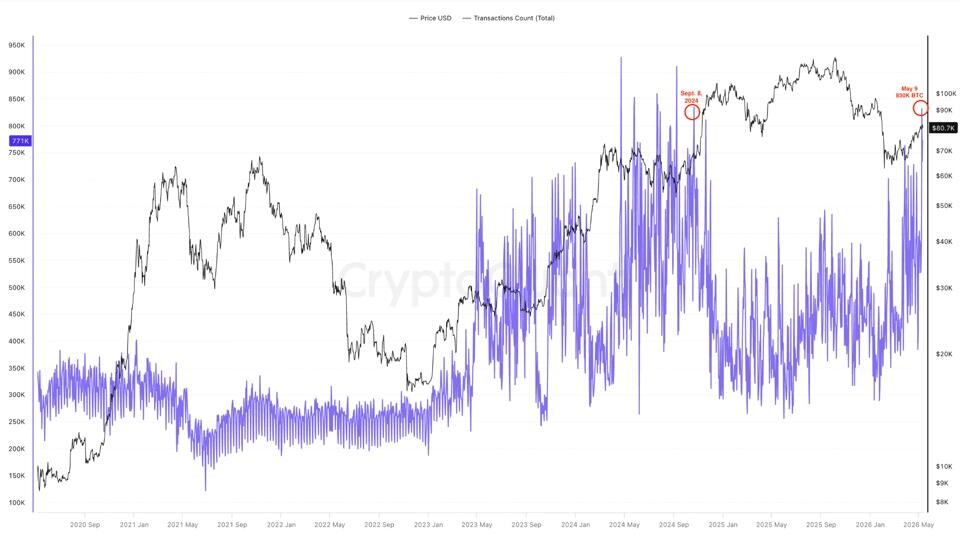
The significant surge in Bitcoin network activity further confirms the strength of the price. The average daily number of transactions in May increased by 116% compared to the previous month, reaching 831,450 transactions on May 9th, the highest in nearly 20 months—the last time it was at a similar level was in September 2024, and Bitcoin subsequently broke through $100,000 during the market frenzy following the US elections.
Chain analyst CW8900 stated bluntly: "The level of network activity even surpassed that of when Bitcoin was at $100,000, signaling a bull market."
The latest "Market Pulse" report from Glassnode shows that the number of daily active Bitcoin addresses increased by 7.1% over the past week to 707,719, and the total transaction fee revenue surged by 37% to $279,300. "Such a significant increase indicates a clear warming of chain activity, potentially indicating bullish market conditions." The synchronized increases in the number of transactions, active addresses, and transaction fees indicate that more users are interacting with the network, often highly correlated with increased market attention and confidence.
"True demand" returns to Bitcoin spot market
The most significant indicator likely comes from the 90-day Bitcoin spot buy volume cumulative volume differential (CVD) which measures the difference between buying and selling volumes over a three-month period.
CryptoQuant analyst Rei Researcher pointed out that this indicator flipped to positive when Bitcoin broke through the $78,000 resistance in early May, and has remained positive since, showing a "major shift in the structure of capital flows." He said, "The dominance of buy-side orders in the spot market means that major funds (whales and institutions) are actively buying and holding Bitcoin at higher prices, rather than merely speculating through derivatives. True demand has taken the lead, and when bulls are willing to pay higher prices for holding Bitcoin, a sustainable upward trend often follows."
Glassnode data shows that Bitcoin spot CVD climbed 47% from $42 million
市场有风险,内容仅供研究参考,不构成投资建议。