US Bank Hartnett: Bull-Bear Indicator Rises to 8.5, It Might Be Time to Sell
Hartnett opened this week's "Flow Show" report with a Rothschild quote: "Buy on the cannon, sell on the trumpet." He implied that as the conflict in Iran tends to subside and good news is densely realized, investors should consider taking profits at the current position.
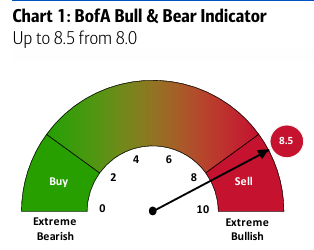
Bank of America's bull-bear indicator rose to 8.5 this week, entering an extremely bullish range, triggering a sell signal for contrarian operations. Since 2002, the indicator has issued 17 sell signals, and within 2 to 3 months after triggering, global stocks have fallen by 2% to 3% on average, with the maximum drawdown reaching 15% to 20%, and the historical win rate is about 60%.
Market breadth data is alarming. Although the S&P 500 has repeatedly hit historical highs, only 21 stocks have set new highs in sync, accounting for only 4%, almost the same as the 20 in March 2000 at the peak of the internet bubble. Within the index, 222 stocks have fallen more than 20% from their historical peaks, and 109 have fallen more than 40%. The pattern of ice and fire is clearly visible.
Funds flow has undergone subtle changes. As of the week of May 27, stocks recorded a net outflow of $7 billion for the first time in nearly 9 weeks, cryptocurrencies outflowed $1.2 billion, and gold also turned to outflow $1 billion. At the same time, bonds continued to inflow for 57 consecutive weeks, attracting $23.6 billion that week, with cash inflows of $2.19 billion, and defensive sentiment has clearly increased.
Regional fund flows show significant differentiation. U.S. stocks have inflow for 9 consecutive weeks with $8.5 billion, but Japanese stocks outflowed $8.2 billion in a single week, setting the largest single-week outflow since May 2025. China funds have outflowed $218 billion since January 2026, which is shocking in scale.
High-net-worth customer positions have reached the limit. Among the $4.5 trillion in assets under the management of Bank of America's private wealth department, the proportion of stocks has risen to 66%, a historical high, while cash has fallen to 9.6%, a historical low, and bonds have dropped to the lowest since March 2022. It is worth noting that cash-type assets recorded the largest single-week net outflow in history this week, while inflows into long-term Treasury bonds of 20 to 30 years have been the largest since October 2022, with customers actively locking in long-term returns.
Hartnett sorted out the asset trend after every bubble burst since 1929, and found a consistent pattern: within 6 months after the bubble peaks, the median yield of 10-year Treasury bonds fell by 45 basis points, and the previously neglected defensive sectors systematically outperformed. Corresponding to the present, since the low point in April 2026, the Nasdaq has soared by more than 80%, and the worst-performing consumer staples, financial, and healthcare sectors are likely to achieve excess returns after the bubble burst.
The "mutation" of AI investment logic is also a core judgment in the report. Hartnett believes that AI leadership will gradually shift from technology "spenders" and semiconductor "builders" to true "applicators". The best trading vehicles are small-cap technology growth stocks, as well as active alternative asset management institutions that can pick up unleveraged quality assets in the market ruins.
Macro events in June are extremely dense, and Bank of America suggests taking advantage of the decline in yields and the rise in stocks to sell high. Key nodes include: US CPI on June 10th, ECB interest rate decision on the 11th, and the FOMC meeting chaired by new Federal Reserve Chairman Wash on the 17th. Hartnett warned that current investors are in a state where "maximizing bull positions" and "very high profit expectations" coexist, which is exactly the most dangerous combination in history.
市场有风险,内容仅供研究参考,不构成投资建议。