Nashnova Research
Can AI Financial Research Be Used Directly? A Hands-On Test of Ant Group's Ling Model on Framework, Computation, and Data Sources
A valuation report complete with core financial data, DCF, sensitivity analysis, and risk disclosures—how far is it from being "ready to deliver"?

This time, we examined 386 financial tasks completed by Ling-3.0-flash-Fin in the nashnova Agent environment. All responses underwent evidence-based evaluation; we then selected 16 candidate cases, recalculated key figures, and traced the external facts cited in the text back to primary sources.
There are two conclusions.
First, Ling can provide useful research frameworks, but a complete framework is still not enough to guarantee reliable key calculations. In two tasks where direct recalculation was possible, the issues already affected per-share valuation, per-vehicle profit, and the directional judgment of scenario changes.
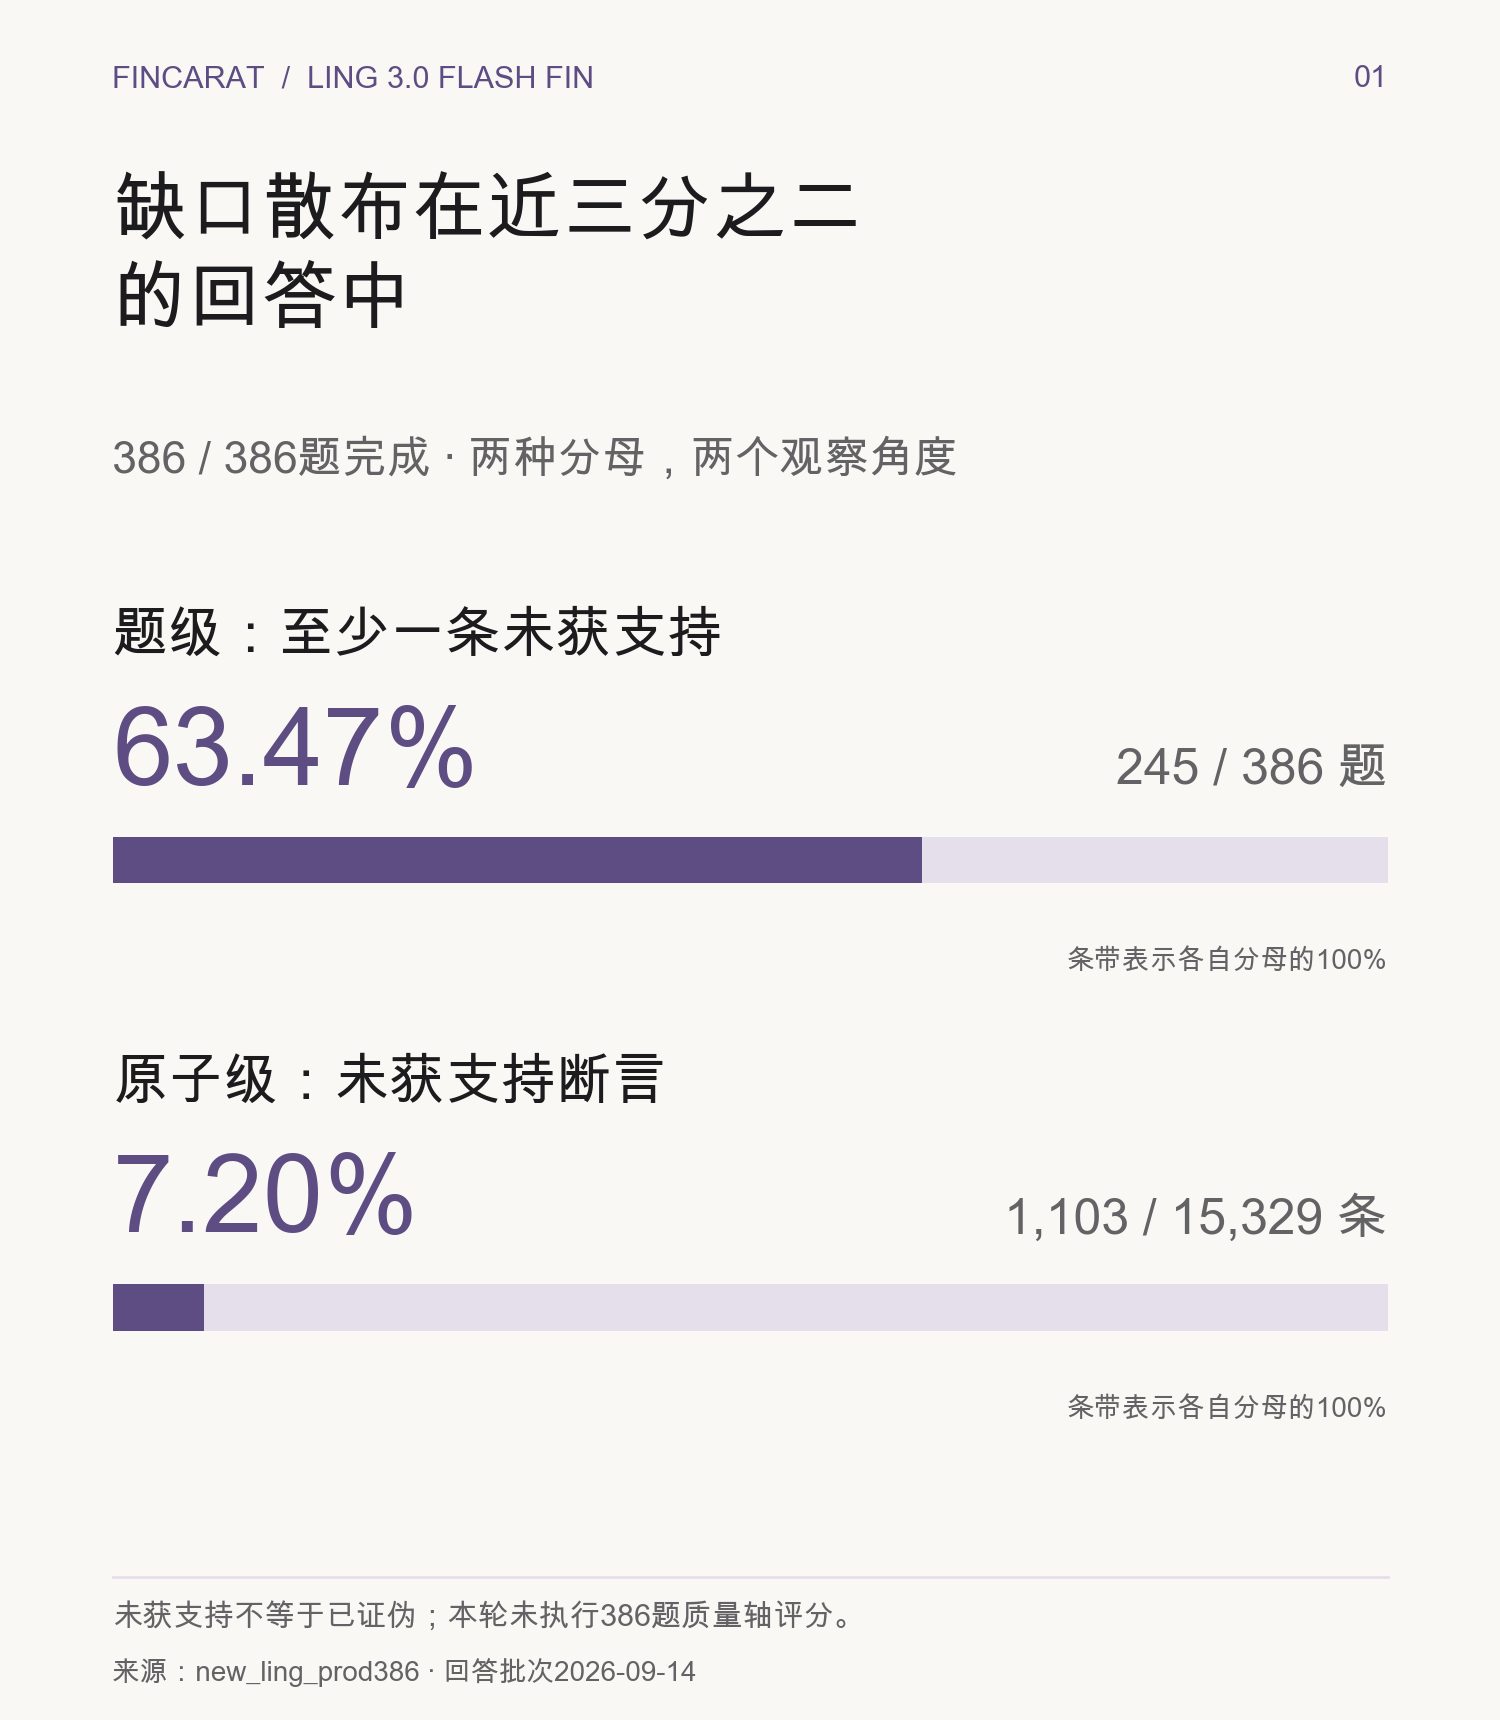
Second, 63.47% deserves attention, but must be read correctly. This is the share of "responses containing at least one unsupported assertion," not that 63.47% of all content is wrong. The more important question to ask is: do the gaps fall on peripheral details, or on positions that determine the conclusion?
01 | Understand the 63.47% Before Judging the Model
The 386 responses in this round were decomposed into 15,329 atomic assertions. Of these, 1,103 lacked comprehensive support, yielding an atomic-level ratio of 7.20%; these assertions were distributed across 245 responses, producing a question-level rate of 63.47%. The two figures are not contradictory: localized gaps can still be widely dispersed across different responses.
"Support" here follows specific rules: the evaluation checks tool-based evidence obtained during response generation, as well as external factual evidence; if either pathway supports the assertion, it is recorded as comprehensively supported. Lack of support could mean factual contradiction, lack of verification, or even explicitly stated modeling assumptions—it cannot all be labeled fabrication. Conversely, having tool-based evidence does not guarantee the data itself is correct.
Therefore, this article refers to it as the evidence gap rate. This round does not include quality-axis scores for all 386 questions, and we will not use it to produce an overall investment research capability score or comprehensive ranking.
Looking at original task categories with no fewer than 10 questions, "Comparison & Screening" showed 29/38, and "Company Fundamentals & Financial Reports" showed 40/62. Gaps were not confined to any single task type; however, different categories vary in difficulty and response length. On the radar chart, higher outward extension means more responses contain gaps—it does not mean stronger capability; the polygon area does not represent a total score either.
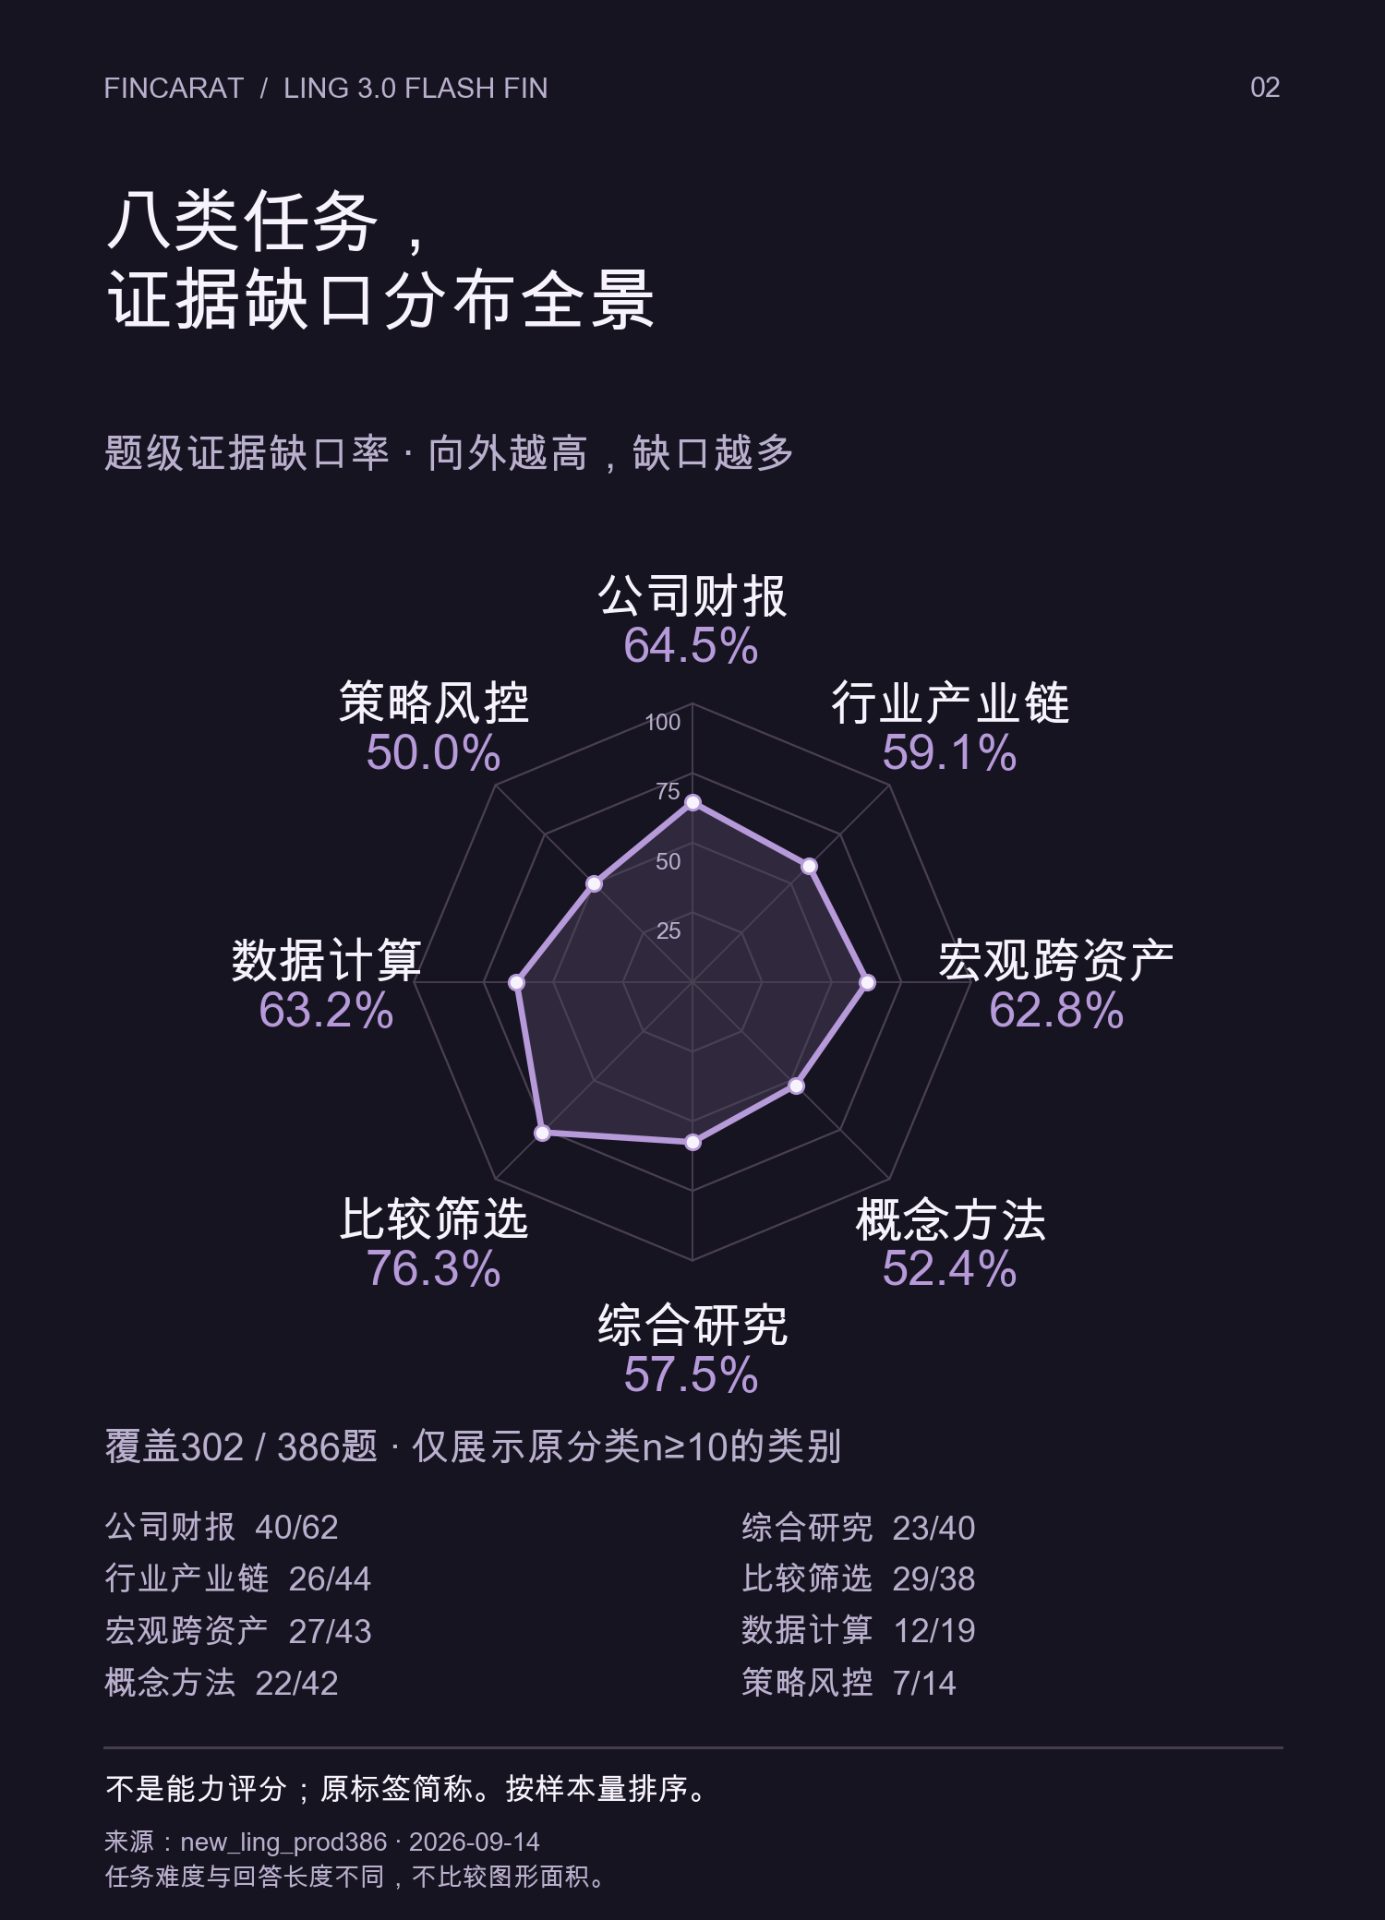
Longer responses are more likely to trigger "at least one gap," and longer responses also contribute more atomic assertions. The overall ratio answers the question of distribution; the cases below help judge the nature of the issues.
02 | What It Does Well: Checking the Research Framework First
Case 1: What indicators should be used to study "supply, demand, and price" in financial leasing?
The user proposed: use LPR to observe price, use aggregate social financing and manufacturing PMI to observe demand, and asked the model to review the approach and suggest additional indicators.
Ling did not simply expand on this framework. It first pointed out the missing supply side, then noted that LPR primarily reflects bank credit pricing, while leasing pricing is also affected by asset risk, tenor, and lessee creditworthiness; aggregate social financing is a macro variable, and more business-proximate observations such as fixed asset investment and equipment renewal should be added. It then organized the indicators into three groups: funding and capital, equipment demand, and leasing yield.
What deserves recognition is that it examined "whether the indicators actually represent the research subject," rather than simply listing more indicators. LPR's positioning as a bank lending rate reference can also be verified against official bank documentation.

This response is still only a useful starting point. It did not provide complete data sources, frequencies, or comparable calibrations; directly calling aggregate social financing "financing demand" is also imprecise. The PBOC defines it as the funds actually obtained by the real economy, not unmet demand. Therefore, we affirm its action of correcting proxy indicators and completing the framework, without packaging this question as if the industry research is already done.
03 | The First Hard Flaw: DCF Is Complete, but the Numbers Don't Add Up
Case 2: Perform a DCF valuation of Haitian Flavouring.
This response looks quite complete on the surface: financial data tables, cash flow projections, discount factors, terminal value, per-share value, and a sensitivity matrix are all present. If checked only by "whether it was mentioned," it would easily pass.
But the original text presents this calculation:
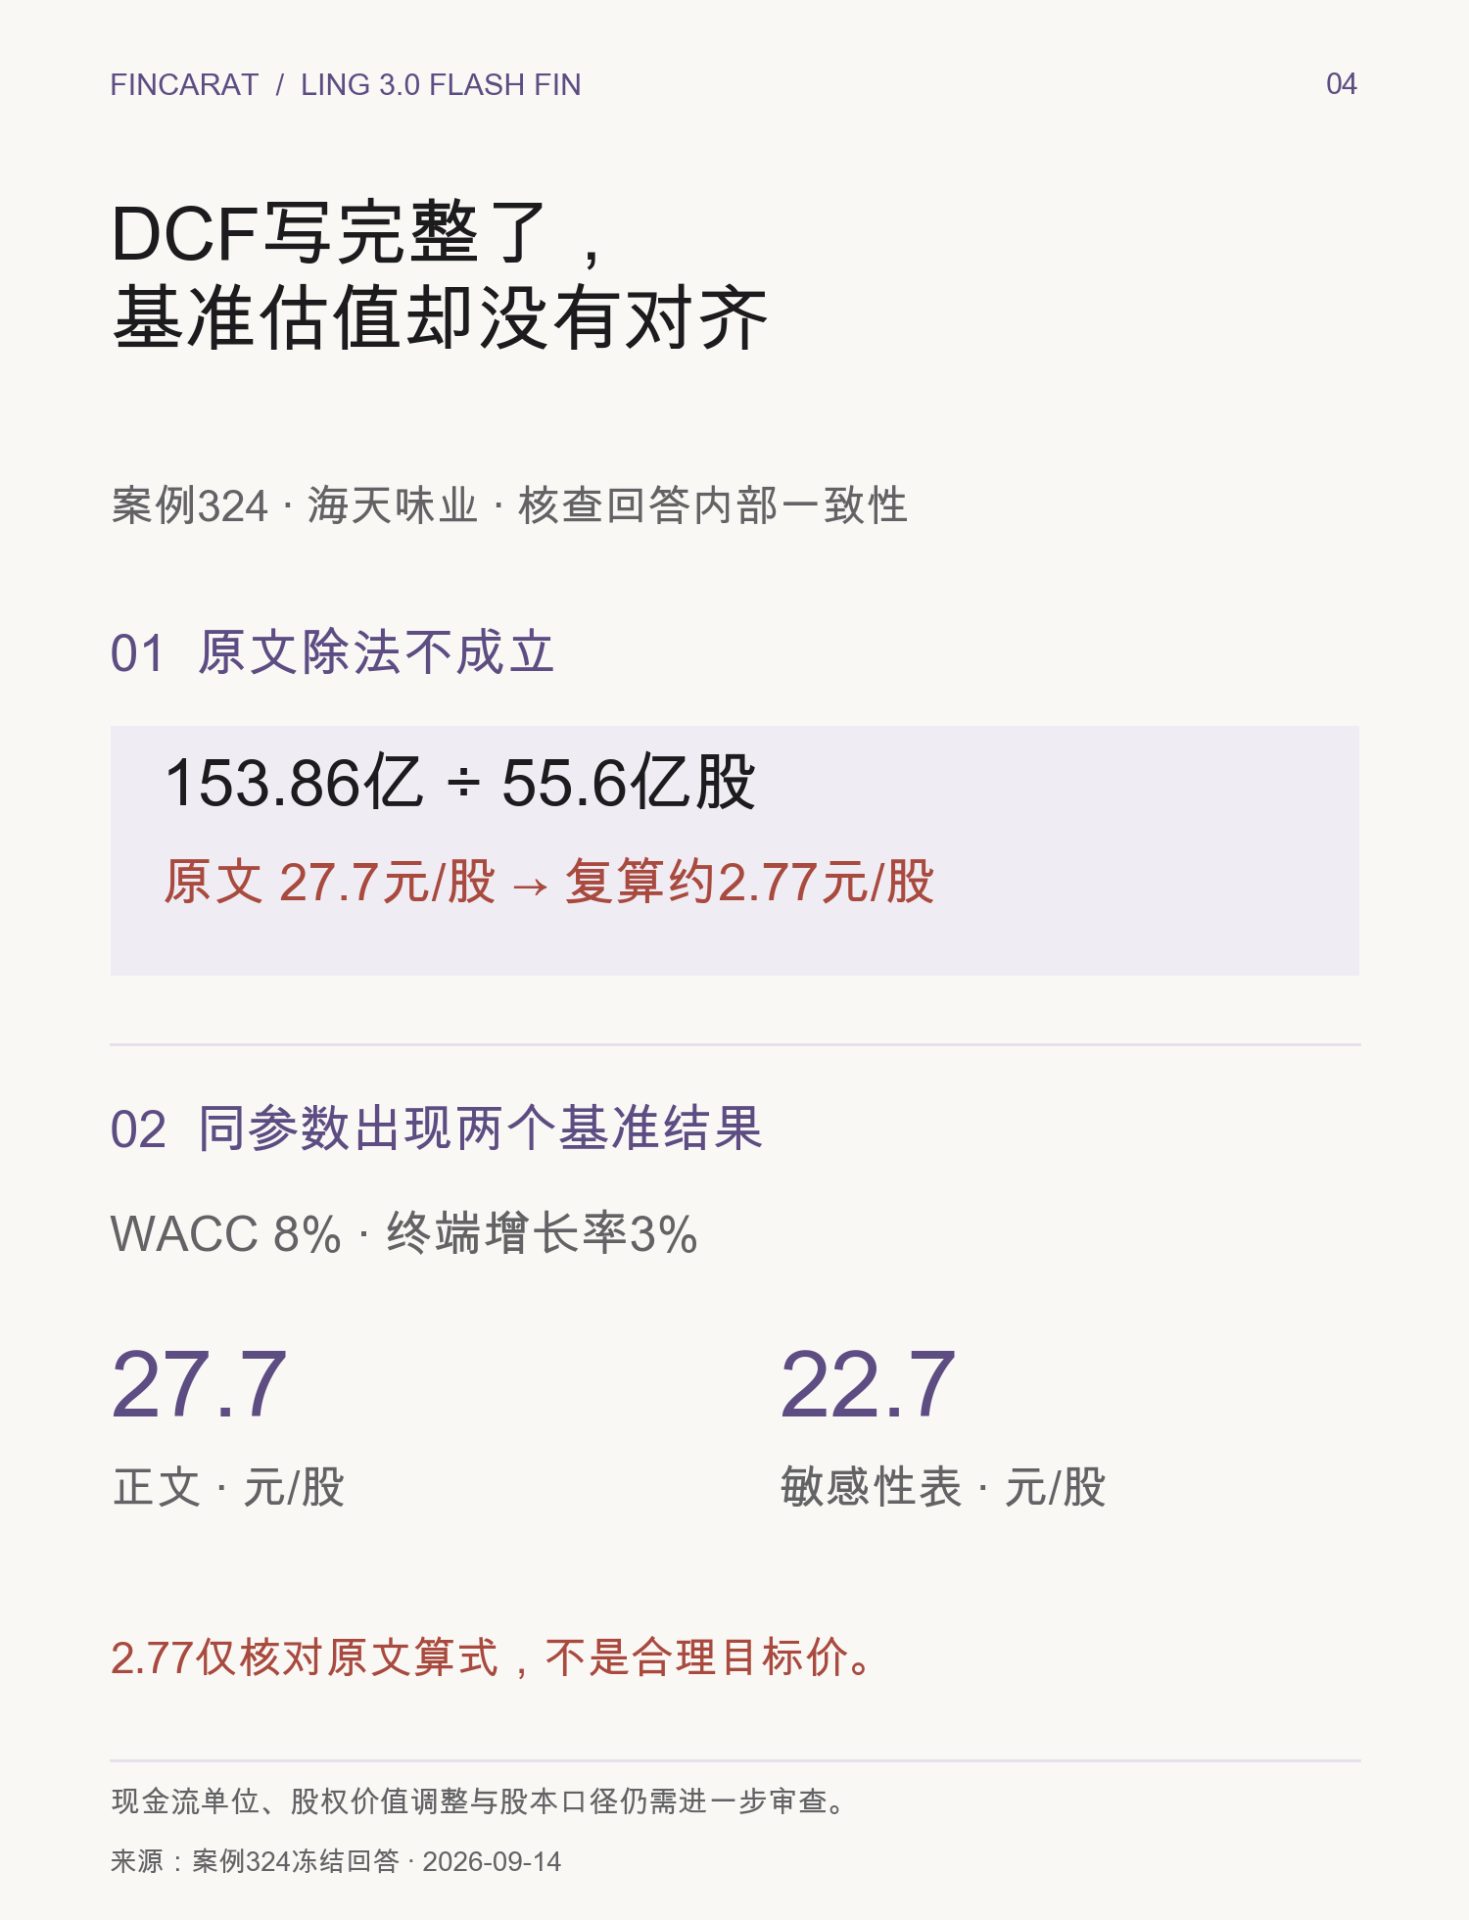
Intrinsic value per share ≈ 15.386 billion / 5.56 billion shares ≈ 27.7 yuan/share
Dividing the same units, 153.86 ÷ 55.6 equals approximately 2.77, not 27.7. This is an arithmetic inconsistency that can be directly reproduced, without needing to first debate whether the growth rate is optimistic.
The problem doesn't end there. Under the same set of parameters—WACC at 8% and terminal growth rate at 3%—Section 3 gives 27.7 yuan, while the sensitivity table's baseline cell and the final conclusion give 22.7 yuan. The same report contains two unexplained baseline valuations.
What truly undermines deliverability is that the reader cannot follow the inputs, formulas, and tables to reproduce a consistent conclusion. Sensitivity analysis is supposed to check the robustness of results; here it instead creates a new contradiction.
It should be emphasized that 2.77 yuan is merely the result of verifying the division in the original text—it is absolutely not a reasonable target price we are proposing. Cash flow units, the adjustment from enterprise value to equity value, and the share count basis all still need to be re-examined.
Similarly, the fact that 32 of this question's 49 atomic assertions lacked support cannot be written as "32 instances of factual fabrication": 5 of them are explicitly stated modeling assumptions. Our criticism targets the verifiable arithmetic and consistency issues, not the act of setting assumptions itself.
04 | The Second Hard Flaw: Correct Formula, but Scenario Direction Still Calculated Wrong
Case 3: Calculate the blended per-vehicle net profit for Q2.
This question provided three groups of sales volumes—domestic legacy, overseas, and domestic second-generation—at 426,900, 471,100, and 210,000 units respectively, along with five sets of per-vehicle profits. Under Ling's own interpretation, each row is a scenario, uniformly weighted by sales volume.
It wrote the formula correctly and got the first scenario right. But for the fifth scenario, with per-vehicle profits of 5,563, 11,126, and 7,000 yuan, independent recalculation yields:
(42.69 × 5,563 + 47.11 × 11,126 + 21 × 7,000) ÷ 110.8 ≈ 8,200.63 yuan/vehicle.
The model's answer was 12,800.63 yuan/vehicle, overstated by approximately 56.09%.
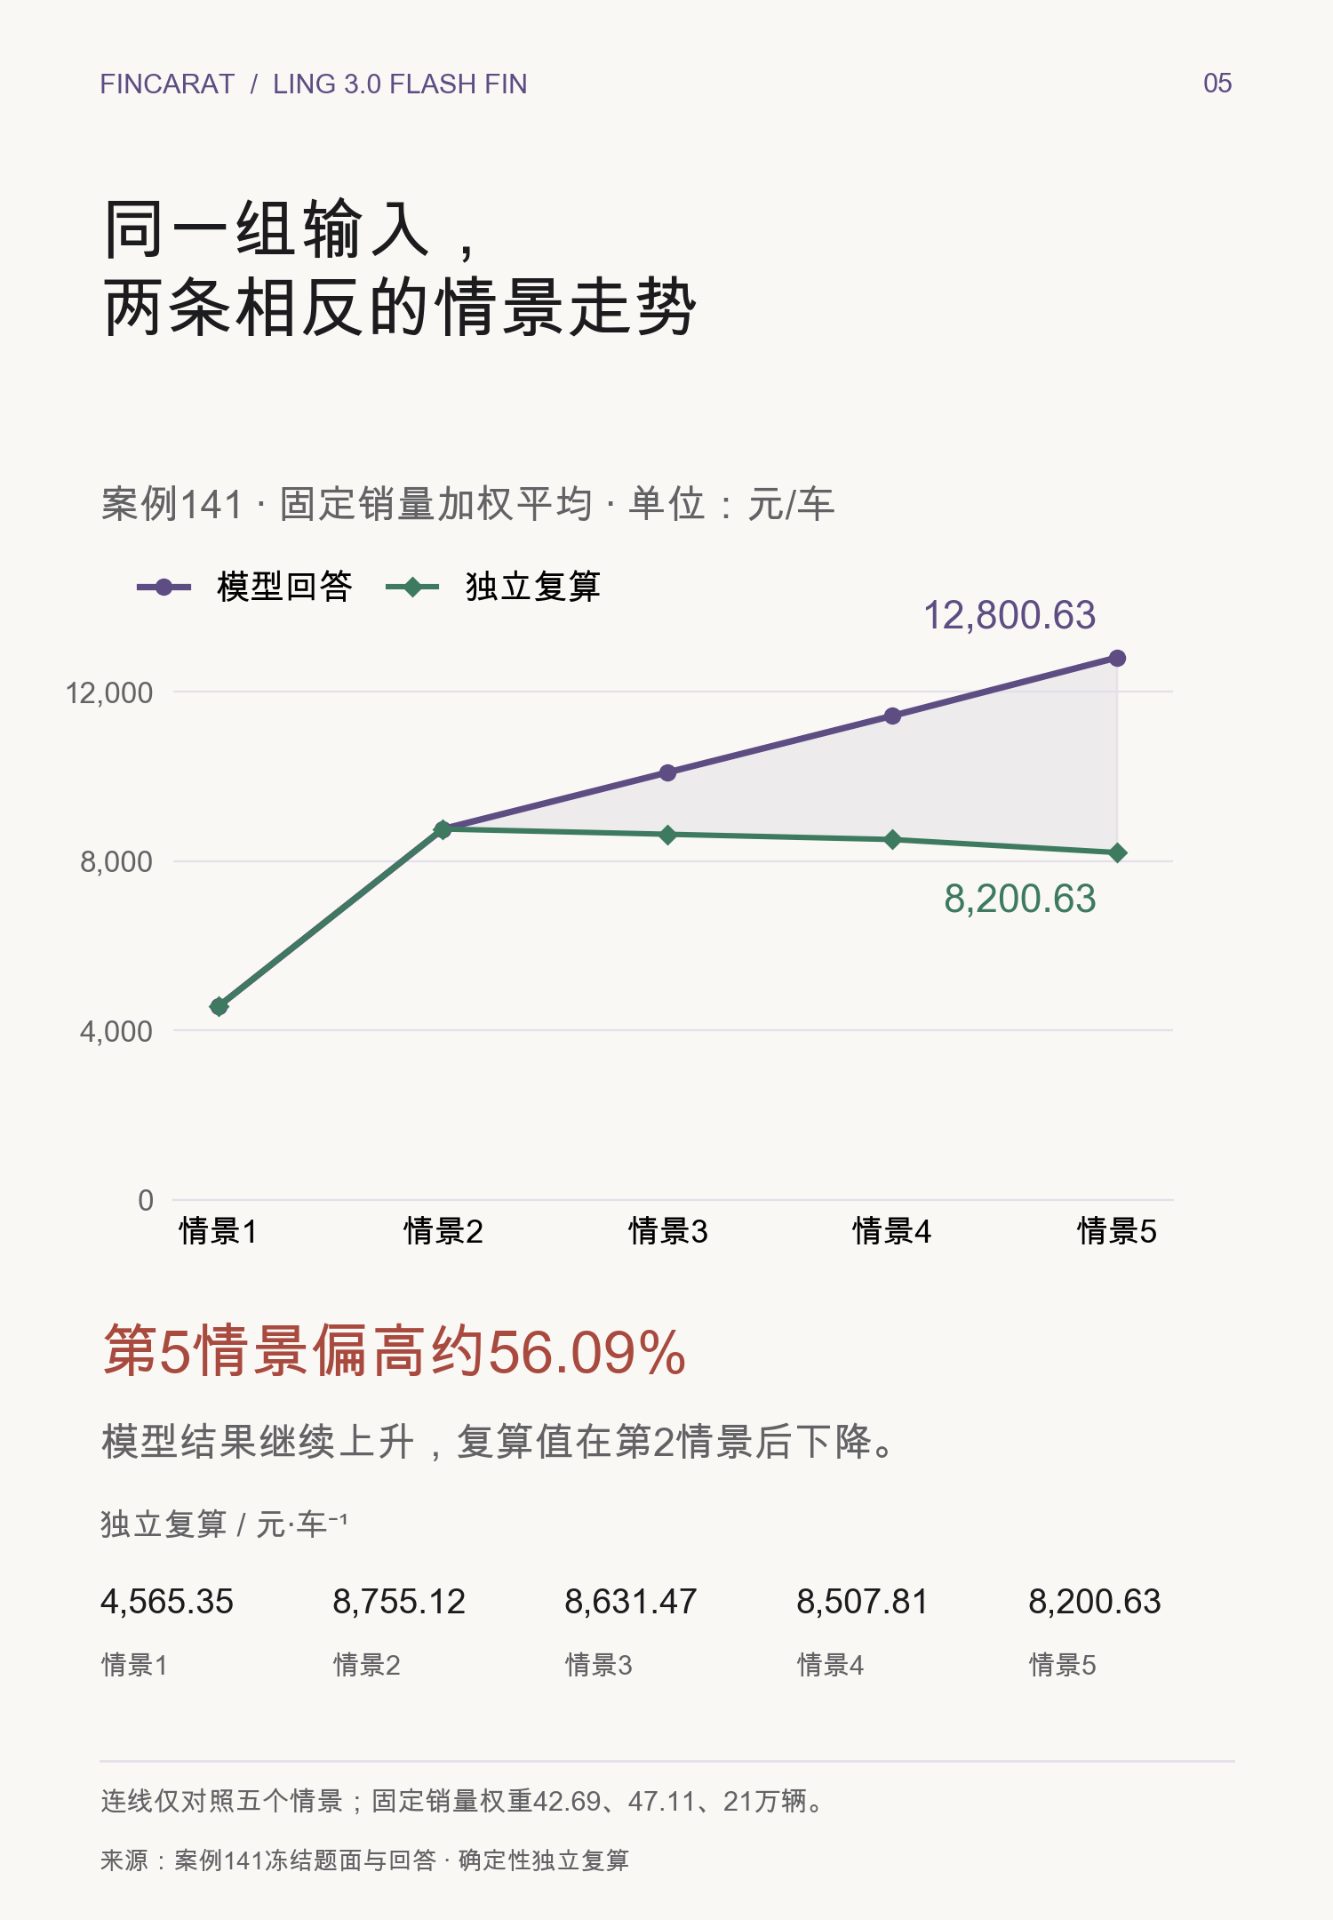
This is not just a rounding error. The model described subsequent scenarios as progressively higher, but the correct sequence actually declines after the second scenario. If these results were carried forward into earnings forecasts, even the directional change across scenarios would be affected.
To be fair, the second scenario differed by only about 0.19 yuan, and should not be given the same weight as the approximately 4,600 yuan deviation in the fifth scenario. The most compelling finding here is: displaying the correct formula is no substitute for actually executing and checking the calculation.
05 | A More Hidden Layer: The Answer Has Evidence, but the Evidence Can Also Be Wrong
Case 4: CNOOC's free cash flow over the past three years.
All 20 atomic assertions in this question received comprehensive support, making it appear to be a positive example. But expanding the dual-axis results reveals multiple factual-axis conflicts—because the tool returns were able to support the original response, they still count as comprehensively supported under the OR rule.
We further traced back to CNOOC's 2023 annual report. Its consolidated cash flow statement shows: net cash inflow from operating activities was 209,743 million yuan, and capital expenditure was 120,875 million yuan. Using the response's own formula of "operating cash flow minus capital expenditure," this yields 88.868 billion yuan; the answer stated 92.382 billion yuan.
The company's performance announcement for the same period disclosed free cash flow of approximately 88.87 billion yuan, which is also consistent with the above calculation.
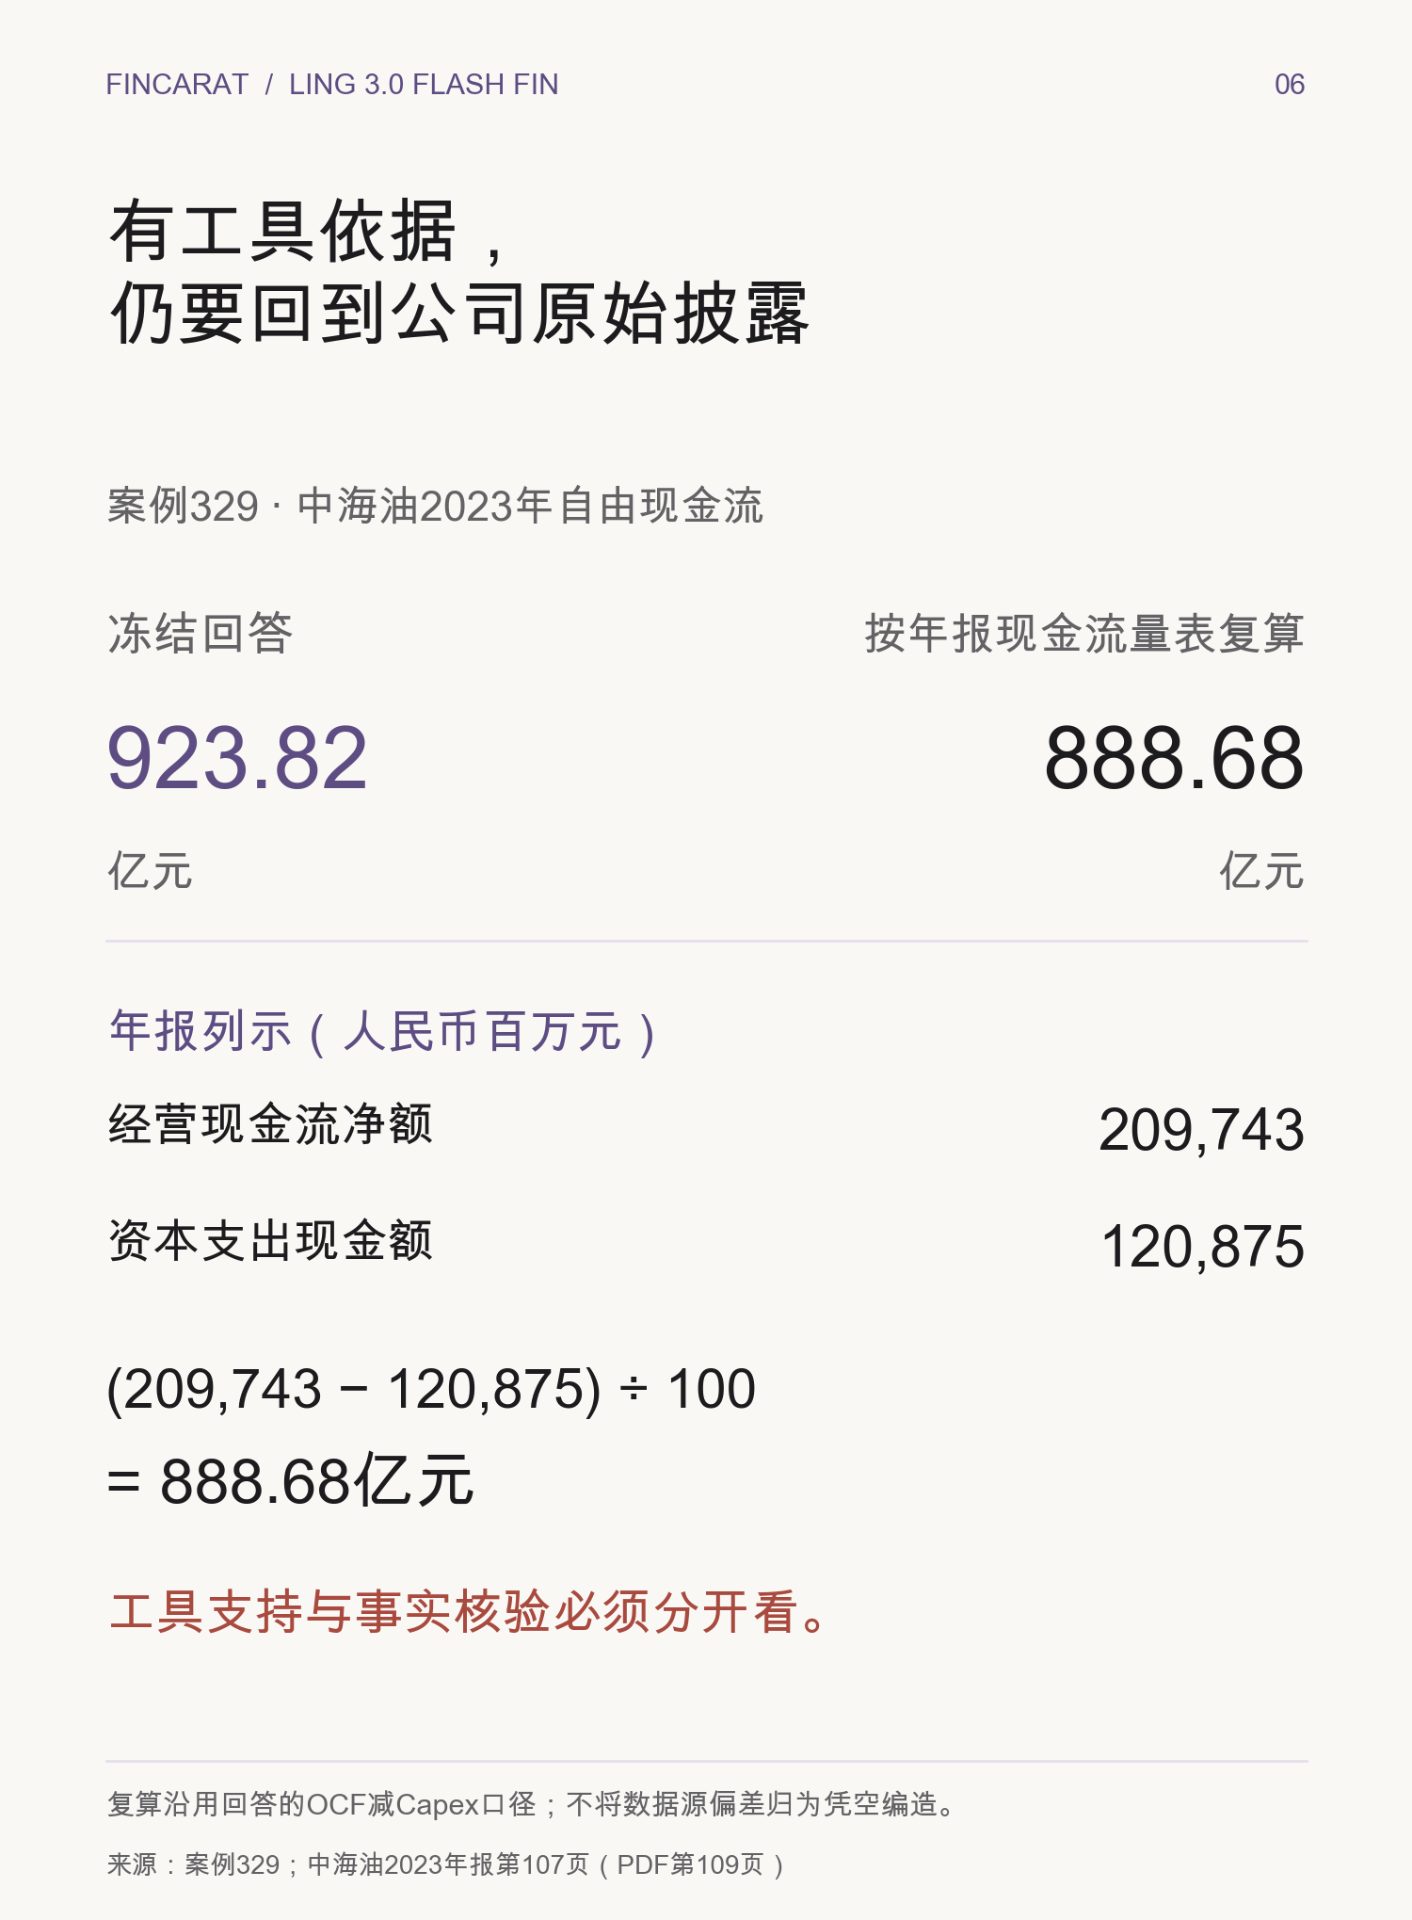
This case cannot simply be blamed on Ling fabricating numbers. The frozen audit-retained tool evidence shows the answer followed the data source's values. What it demonstrates is: the delivery reliability of financial research must cover the entire chain—data source, model processing, and final verification. Faithfully relaying incorrect data still produces incorrect results; "zero evidence gaps" cannot be treated as a 100% factual accuracy rate.
06 | How We Would Use This Model
Based on this round of results, we are willing to let Ling participate in research drafts: checking whether the problem decomposition is complete, proposing candidate indicators, and organizing paths that need further verification. The financial leasing case demonstrated the value of this type of work.
But when it comes to valuation, profit, and cash flow, we will not skip three checks: tracing key inputs back to company disclosures and aligning entity, period, and units; running the numbers through reproducible programs; and finally checking whether the text, tables, and conclusions are consistent. Even when data comes from tools, the entry point for tracing back to original sources must be preserved.
This round did not include a cost-benefit experiment, so it cannot be used to judge whether this is the most cost-effective option; without complete quality-axis scores and rigorously controlled horizontal comparisons, it is also inappropriate to declare it comprehensively ahead or behind. The four selected cases are used to explain mechanisms and do not represent the frequency of these mechanisms across all 386 questions.
The judgment from this hands-on test is clear: Ling can help build financial research frameworks, but turning a framework into a deliverable conclusion still requires item-by-item verification of key figures. The trust most worth building is not "whether it looks like a research report," but whether the reader can follow the evidence and calculations to independently reproduce the conclusion.