
From indicator testing to a monitoring workspace
Build a reversal signal workspace with nashnova
The first thing that caught our attention about SRP was not the code but the arrows on its chart. After several sharp falls, they appeared near the start of a rebound. After a few charts, it was tempting to ask: could a daily scan alert us whenever an arrow appeared? We gave nashnova the source code and started investigating.
Product screenshots show the original Chinese interface.
The indicator is called Simple Reversal Point, or SRP. Its source is only a dozen or so lines: identify a new low, look for an engulfing candle, then draw an arrow. The logic sounds reasonable, but charts can be deceptive. If you only look back at successful rebounds, almost any indicator can look accurate.
Instead of asking what to buy, the user pasted the complete source into nashnova: What exactly does this arrow detect? Does it still work in a different market or on a different time frame? The backtests, failures and eventual workspace all grew from those two questions.
On this page
01 Understand the arrow
With unfamiliar indicator code, it is easy to guess its purpose from the name. Here, we did the opposite: paste the complete source into the conversation and ask nashnova to explain each condition.
I found an interesting reversal indicator on TradingView. Please explain how it works and why it might be effective.
It detects a bullish engulfing candle after a recent low, with mirrored conditions for a bearish signal. The lowest price in the last three candles first falls below the low of the preceding 50 candles. A bullish candle then closes above the open of the previous bearish candle, recovering its entire body.
It is closer to a false-breakout reversal detector. Price sweeps through stops and short entries near the previous low, then quickly recovers, which may indicate buying support.
c1 = close[1] < open[1] and close > open
c2 = close > open[1]
c3 = lowest(low, 3) < lowest(low, 50)[1] ...
buy = c1 and c2 and c3
This produced no buy or sell recommendation, but it defined the scope of the research. c1 and c2 test the switch from a bearish to a bullish candle and the recovery of its body; c3 tests price location. Without location, ordinary engulfing patterns are too common. Without recovery, a new low alone cannot establish a reversal.
nashnova also flagged risks in the code: 3 and 50 are empirical parameters that may not suit every asset or time frame. An alert before the candle closes may appear intraday and disappear by the close.
A screenshot with an arrow only shows that a rebound once happened there. Source code specifies conditions, offsets, windows and closing confirmation. If a backtest does not match, you know where to investigate.
With the logic understood, the next step was to test other charts: equities, then gold, bonds and BTC, across daily, four-hour and weekly time frames.
02 Test other markets
The user took the question further: how would the same rules perform on equities, gold, bonds, cryptoassets and mainland Chinese stocks, using four-hour, daily and weekly candles?
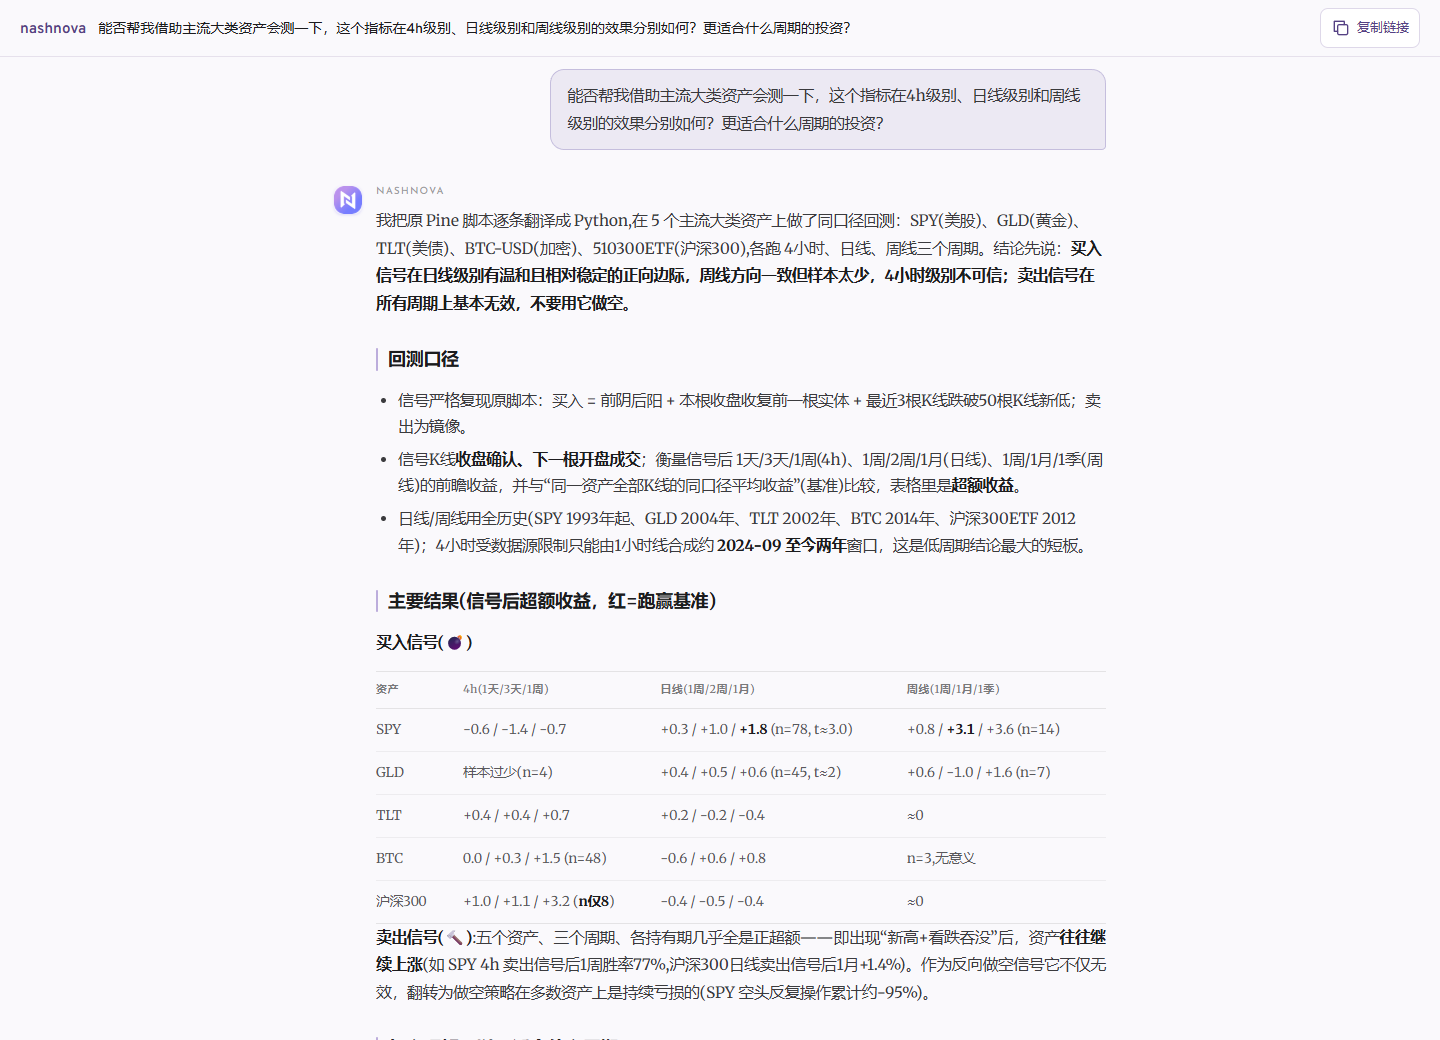
The backtest first fixed the details that are easy to leave vague: confirm at the candle close and execute at the next open. Use as much history as possible for daily and weekly data; flag the roughly two-year limit for four-hour data. A short history does not become long-term evidence because the results look appealing.
There was no simple verdict of “works” or “does not work.” Daily bullish signals had a modest positive edge on assets such as SPY and gold, with relatively adequate samples. Weekly results pointed in a similar direction but had too few signals to rely on. Four-hour results varied sharply, and roughly two years of public data was insufficient evidence for using them alone.
Bearish signals were more surprising. Several assets with long-term upward trends often kept rising after a bearish engulfing candle at a new high. That side of the indicator was retained as a risk alert rather than a short-selling rule.
Use daily bullish signals as candidates for review, keep four-hour signals in their daily context, and do not mechanically mirror the rules for bearish signals. The first cross-asset test narrowed the research scope
The results were not tidy, but they were honest. Four-hour history was short, weekly samples were small and bearish signals sometimes pointed the wrong way. They were not bundled into a claim that the indicator worked overall. Daily bullish signals warranted further study; the others needed more caution.
03 A strategy changes the result
Daily confirmation creates a practical problem: by the close, price may already have rebounded. The user proposed using a four-hour signal for an initial position, then adding only after a daily signal confirmed.
nashnova tested the idea. When daily prices were near an extreme, the proportion of four-hour bullish signals that developed into daily signals within five trading days rose from about 15.5% to 39.3%. The probability of a gain after one week also improved. These figures made it tempting to turn the idea into a strategy.
Adding stop-loss and take-profit rules changed the story.
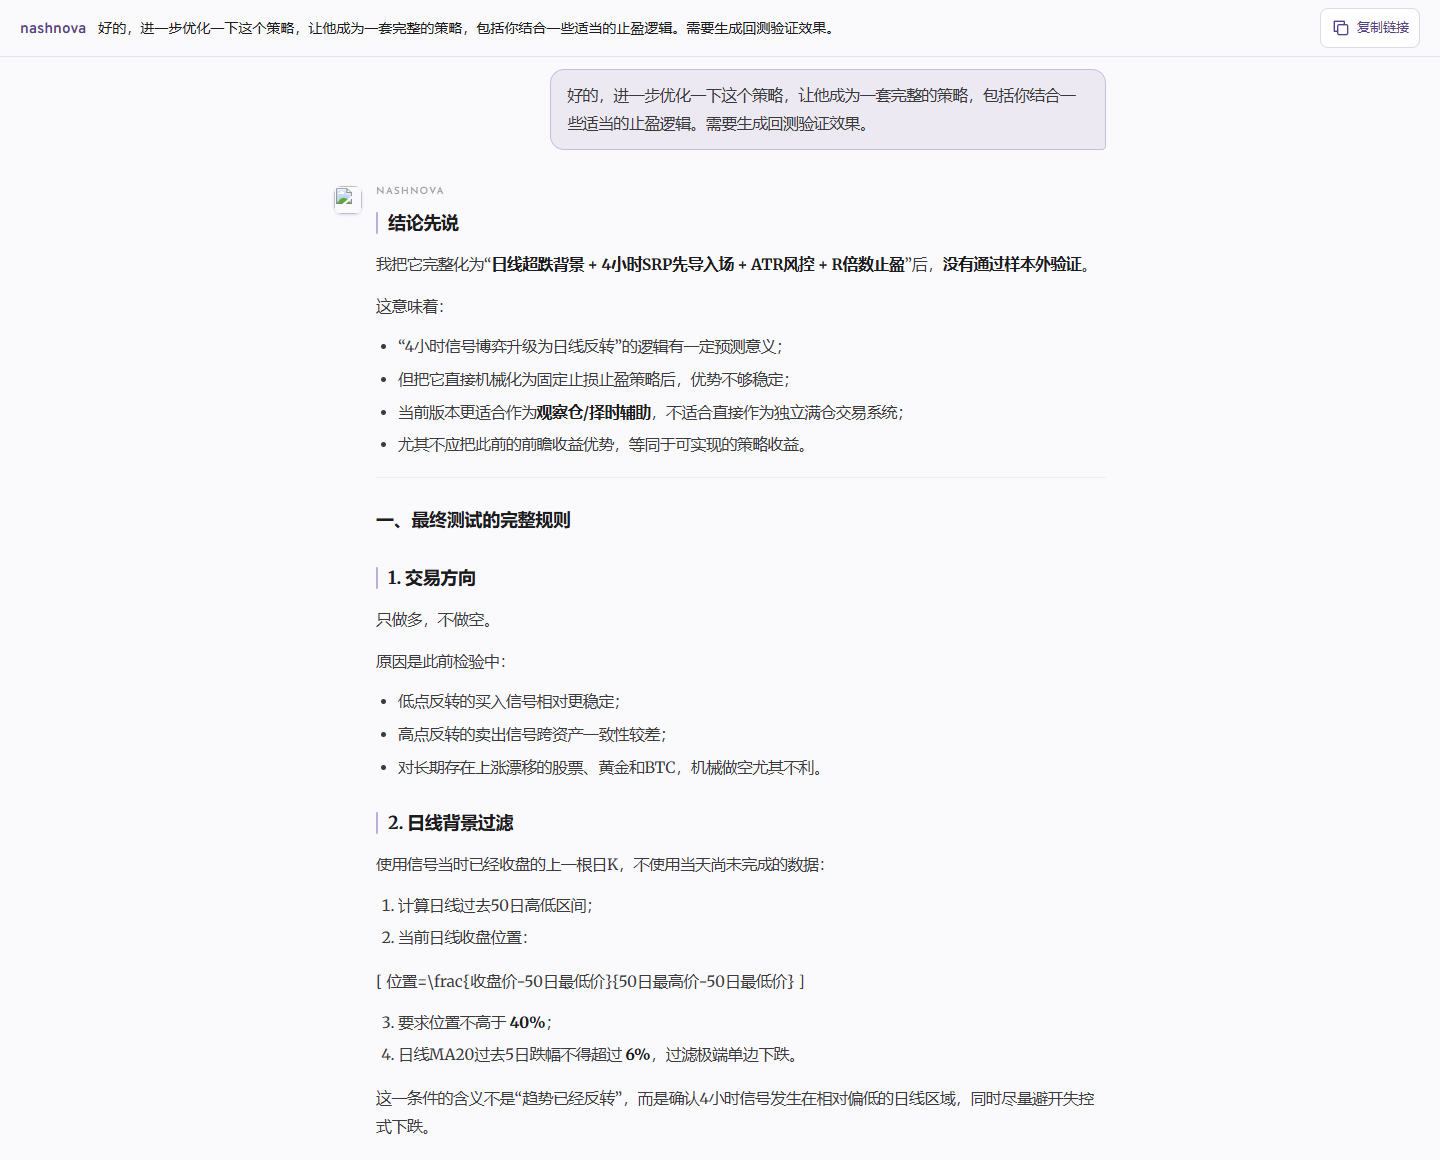
The second half of the data, which was not used to tune parameters, produced 34 trades with a win rate of about 20.6%. Total profits were only 54% of total losses. Average cumulative performance across five asset classes was approximately -3.2%.
Additional filters were tried, with the stop widened to twice normal volatility and the profit target raised to three times the risk distance. Training results improved, but the average loss in the second half widened to about 7%. More tuning made it worse.
The problem was the path between entry and exit. Many reversals retested the low before rising, triggering a fixed stop first. When a larger move did occur, a fixed profit target exited too early. Equity indices, bonds and BTC also have very different volatility patterns, making shared parameters a poor fit.
The figures brought that approach to a halt. Further tweaks to stop distances were unlikely to answer the real question. It was time to ask a different one.
04 Track signal states instead
The user reframed the idea: after a signal, price holding above a short moving average might indicate that the reversal remains intact; a close below it might indicate weakness. A break of the prior low could mark outright failure. This was simpler than trying another set of profit targets.
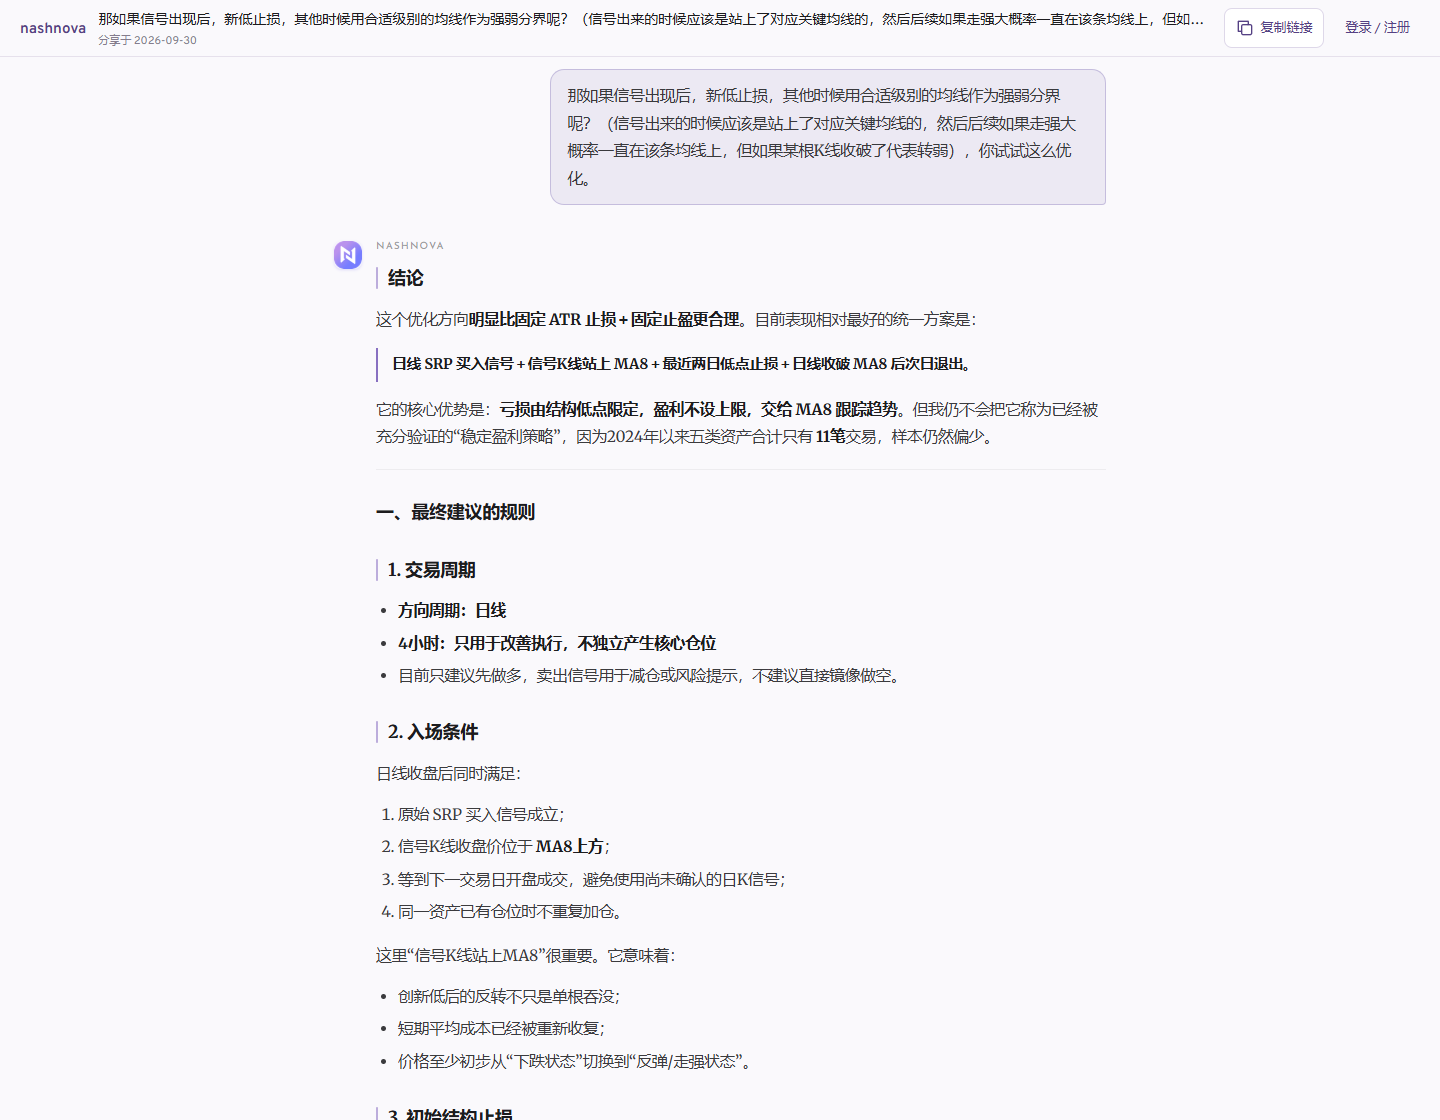
Since 2024, this version averaged approximately +4.0% cumulatively across five asset classes, but there were only 11 trades and most of the profit came from a few of them. It looked better than fixed profit targets, and that was all. It was far from evidence of a consistently profitable strategy.
It did, however, provide useful states to record: newly triggered, still above MA8, weakening or below the previous low. Each day, identify assets whose state changed, then decide which charts deserve closer inspection. This became the basis for the workspace.
The conversation followed a natural pattern: the user offered an intuition, and nashnova converted it into rules and tested it with data. The first question did not need to contain every answer.
05 Expand to 45 assets
Five assets were not enough. The pool grew to 45, including mainland Chinese, Hong Kong and US indices, sector ETFs, cryptoassets and major Chinese and US stocks. The rules stayed unchanged: a daily reversal signal, price above the eight-day moving average, and the low of the last two days as the failure threshold.
Results diverged. Broad US equity ETFs were the only group in which every instrument was positive, averaging about +10.5% across four ETFs. Hong Kong index ETFs averaged roughly +5.7%, largely driven by Hang Seng Tech. Positive results among mainland Chinese sector ETFs were concentrated in semiconductors.
Mainland Chinese broad-market ETFs and major stocks averaged approximately -1.0% and -0.8%, respectively. US sector ETFs and major stocks showed no broad advantage either. Cryptoassets generated only four trades in total, with BTC, ETH and SOL behaving differently, so their ranking had little evidential value.
A broader sample supported narrower conclusions. SRP could prioritize monitoring of highly liquid broad-market ETFs. Sectors, individual stocks and volatile assets could still appear in the workspace, but should not receive equal confidence. Mainland Chinese semiconductor ETFs performed well while SOXX and SMH performed poorly: the same industry label does not imply the same price behavior.
The parameters were not retuned during expansion. Changing the rules whenever an asset performs poorly can always produce an attractive historical result, but it stops being a meaningful validation.
06 Decide what to review first
Reviewing 45 charts from scratch every day is hard to sustain. The workspace first highlights what changed: a new reversal, continued strength, a fall below the eight-day moving average, a break of the signal low or emerging downside risk. The rest can wait.
Start with Recent triggers and Bearish risks, then open individual charts. An arrow is only the beginning; the page tracks what happens afterward. Bearish arrows remain alerts, without becoming automatic short orders.
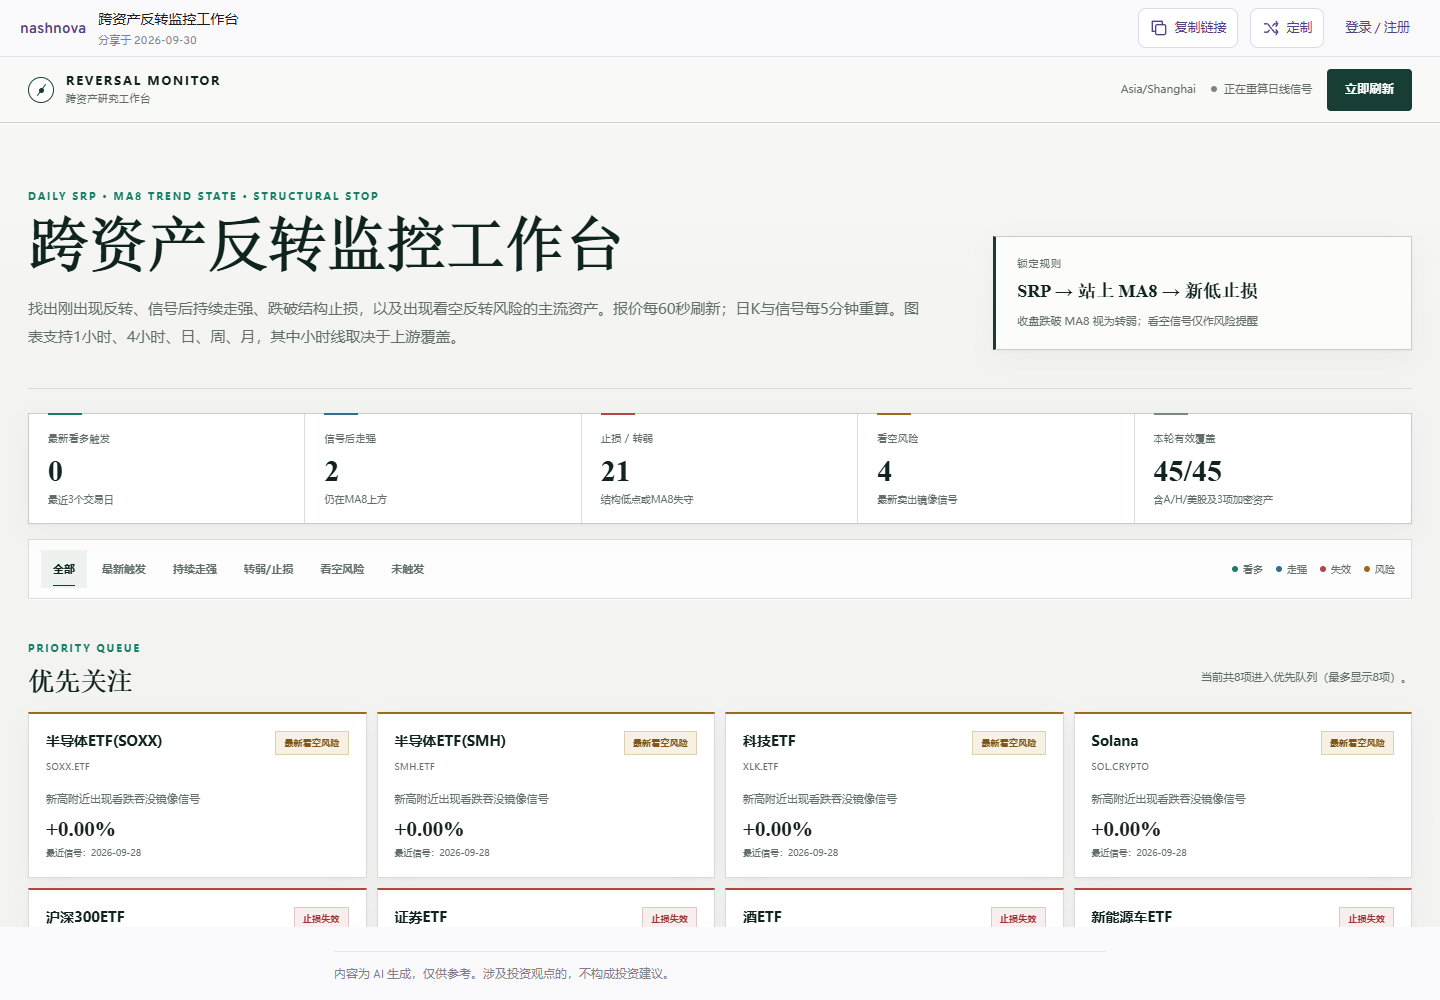
Charts explain where a signal stands
The workspace uses TradingView Lightweight Charts for one-hour, four-hour, daily, weekly and monthly views. Each time frame calculates SRP independently: red upward arrows mark bullish signals, green downward arrows mark bearish risk, and MA8 is overlaid on the chart.
The strategy's primary evaluation still uses completed daily candles. One-hour and four-hour views help examine retests, whether a reversal is spreading to higher time frames and possible execution levels after a gap up. The instructions state this boundary explicitly so intraday arrows are not mistaken for a new primary strategy.
Show a snapshot first, then try to refresh
The first workspace sometimes kept loading indefinitely. The cause was inconsistent ETF and cryptoasset symbols across markets, which caused a batch request to fail and block the page. The fix standardized all 45 symbols for the gateway and embedded a recent snapshot in the HTML.
The page can now show complete states even when the market-data API is temporarily unavailable. If a refresh returns too few candles, it keeps the full snapshot and labels the refresh as degraded. Users see the data's status instead of a blank page.
nashnova delivered the HTML, calculation scripts, sample data and instructions. The page could open directly, but the first version was only functional. Further conversation made it something worth checking every day.
Feedback was specific: the latest data was missing, key time frames were unavailable after switching assets, and the candlestick chart occupied too much space. These issues were much easier to address than a vague request to make it look more sophisticated.
07 Refine the first version
The latest data is not visible when I open the page.
Fixed ETF and cryptoasset symbols, added an embedded snapshot and made data-quality states explicit.
Some data is still missing. When I select an asset, I want to see its main time frames, with instructions included in the workspace.
Added Lightweight Charts with daily, weekly and monthly views, followed by one-hour and four-hour views, plus a three-step guide.
Place a collapsible candlestick chart above the list, show SRP on the chart, add sorting and filtering, and use a lighter, more restrained visual style.
Added collapsible charts, signal markers for each time frame, combined filtering and sorting, a light research-terminal design and responsive layouts.
You do not need to explain the strategy again to change the page. Stay in the same conversation and point to the specific module. For example: “Clicking the CSI 1000 four-hour cell does not switch the chart. Keep my filters and load the corresponding hourly candles.”
That sentence identifies the location, action, problem and expected result. Useful technical revisions often start with small, precise feedback like this.
08 Reuse this workspace
To avoid repeating ten rounds from scratch, open the nashnova share page below. The conversation already contains the original indicator, backtests, monitoring rules and page requirements.
Open the share page, sign in to nashnova and continue from the existing conversation. Change the asset pool, time frames or page design to suit your research.