
From a strategy idea to testing and refinement
Multi-asset rotation: from first draft to revised strategy
I started with just three requirements: multiple assets, weekly rebalancing and execution through mainland China-listed ETFs. About ten minutes later, a complete rule set and backtest came back. The numbers were reasonable, but something still felt wrong.
Product screenshots show the original Chinese interface.
My initial idea was reversal: would assets that had recently fallen sharply rebound over the next period? Selecting weekly across mainland Chinese, Hong Kong and US equities, gold and bonds might avoid the limitations of a single market.
The idea was incomplete. I had not defined “fallen sharply,” decided how long to hold, addressed unused allocation or considered premiums on cross-border ETFs. I gave nashnova one plain-language sentence to see how far it could take the question.
On this page
01 Describe the idea
I did not begin with a complicated prompt. The entire starting point was one sentence, shown in the screenshot below.
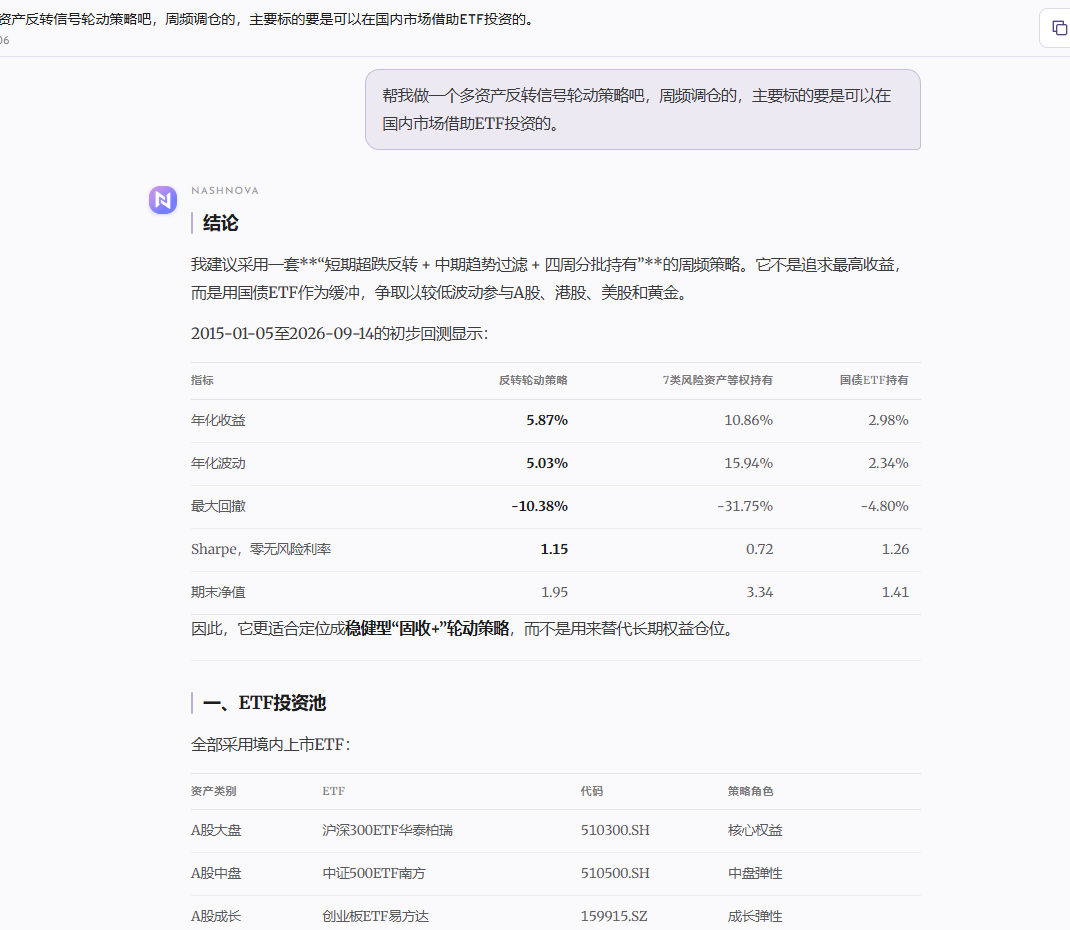
The first version was restrained. It did not buy simply because an asset had fallen. It first applied a 26-week trend filter, then split the portfolio into four sleeves and replaced one each week. Allocations without qualifying opportunities went into a government-bond ETF.
It was already addressing gaps in the original idea: avoiding falling knives and preventing a single noisy weekly signal from turning over the entire portfolio. It also specified the asset universe, calculation time, execution time and cost assumptions. The idea had become a set of testable rules.
02 Review the first backtest
The backtest returned 5.87% annualized, with 5.03% volatility, a -10.38% maximum drawdown and a Sharpe ratio of 1.15. The figures looked orderly, but they raised another question: why was it so stable?
The answer was further down the report. The strategy held only government bonds about 53% of the time, with average risk-asset exposure of just 16.2%. Low volatility came largely from low exposure, not solely from a strong reversal signal.
An equal-weight portfolio of the seven risk assets returned 10.86% annualized. The first version reduced maximum drawdown from -31.75% to -10.38%, but also gave up substantial return. It could be viewed as a conservative bond-plus rotation approach, but it fell short of my goal of meaningful excess returns with a better risk-return balance.
Further fine-tuning of the reversal window would not solve the problem. The issue was not one week versus two; reversal had been asked to do too much. An asset might have fallen because of temporary mispricing or because a decline was just beginning. The size of the fall could not distinguish between them.
The first draft was useful because it clarified the problem. Before adjusting parameters, we needed to rethink reversal's role in the strategy.
03 Rethink the approach
I stayed in the same conversation and kept the asset universe. I simply explained what was unsatisfactory: reversal was not working well on its own. Could we find complementary ideas?
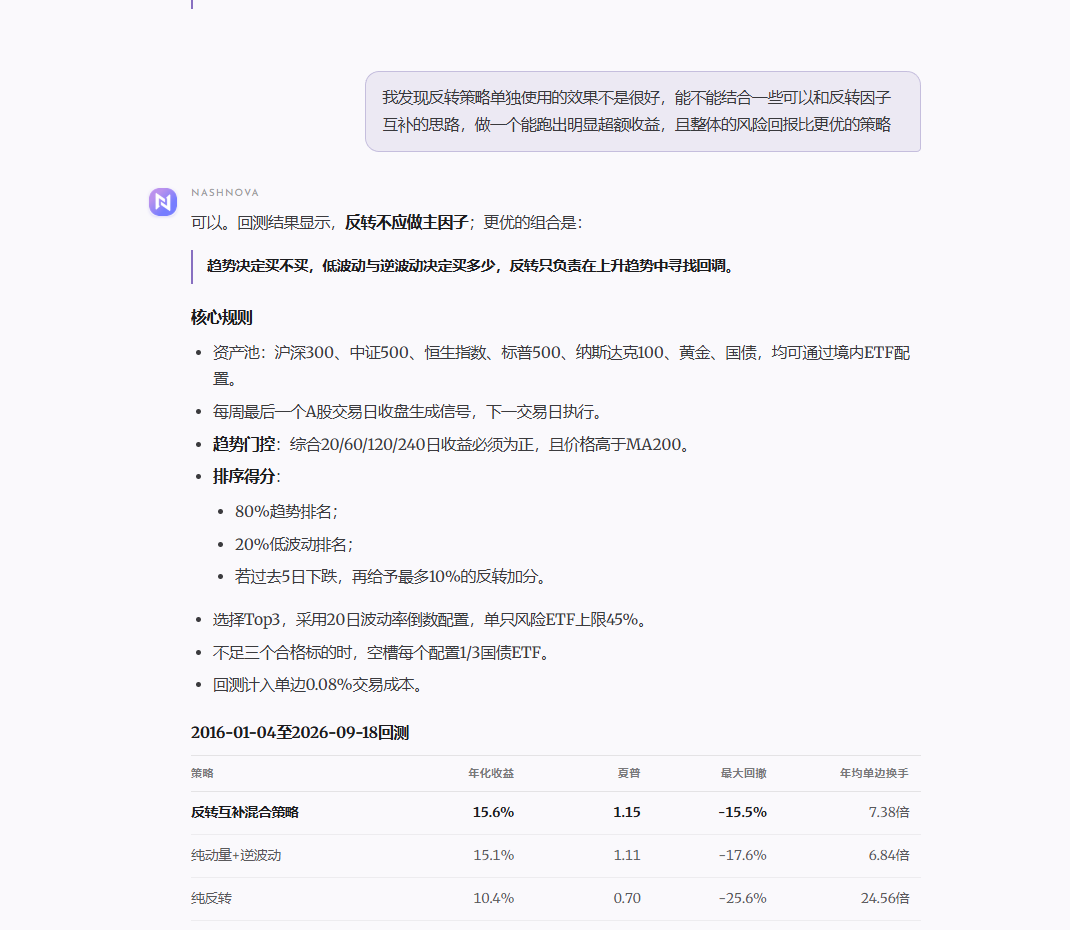
The second response changed the premise: reversal should not be the primary factor. Trend would determine eligibility, low volatility and inverse-volatility weighting would determine allocation, and reversal would add a small bonus for a short-term pullback within a longer-term uptrend.
That distinction mattered. The first version added a trend filter to oversold assets. The second first found assets in an uptrend, then used reversal to identify pullbacks. Changing the order changed how the strategy behaved during persistent declines.
The rules changed accordingly: a composite of 20-, 60-, 120- and 240-day returns had to be positive, and price had to exceed its 200-day moving average. Select the top three qualifying assets and weight them by the inverse of 20-day volatility, capped at 45% per asset. Fill any unused slots with government bonds.
04 Test the revised strategy
The revised backtest returned 15.6% annualized with a -15.5% maximum drawdown and a Sharpe ratio still at 1.15. The improvement was substantial on those measures. The final page also compared cumulative performance and drawdowns against alternative strategies.
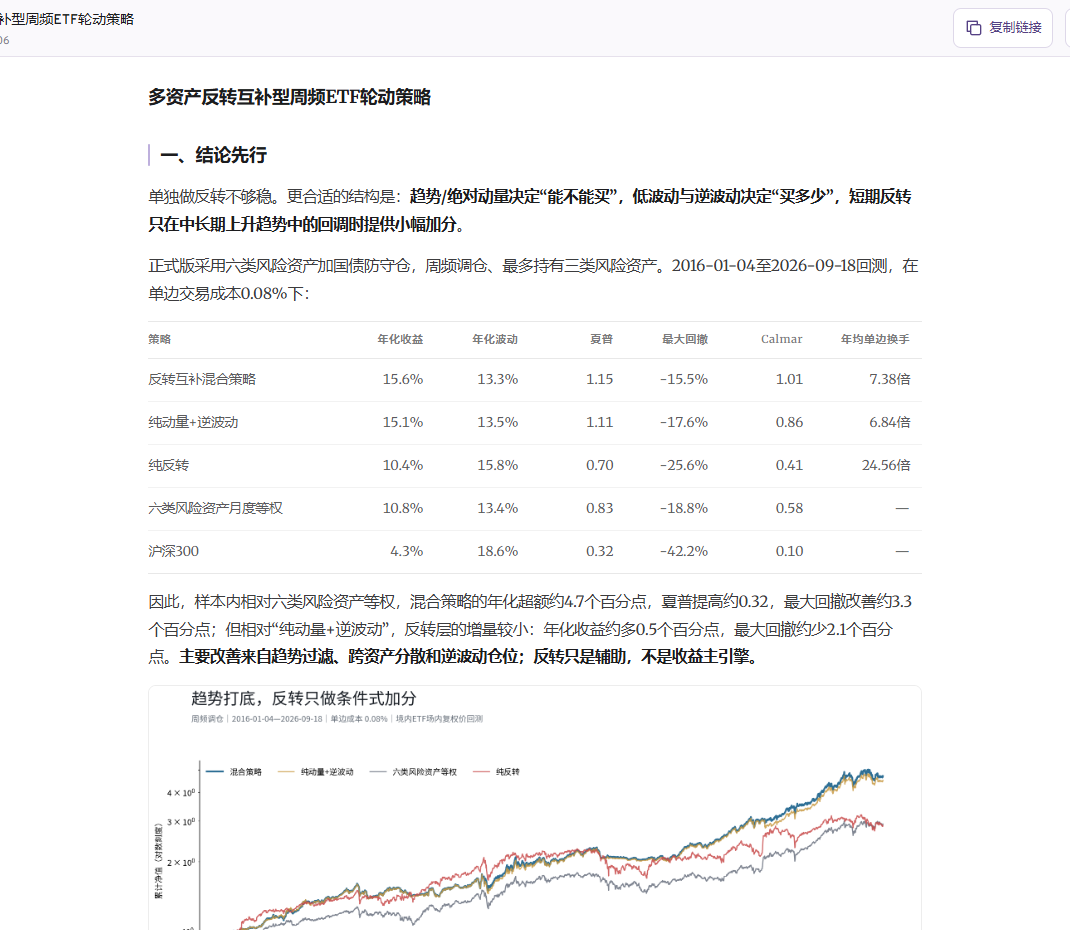
One detail was easy to miss. Pure momentum with inverse-volatility weighting already returned 15.1% annualized; the hybrid added just 0.5 percentage points. Maximum drawdown improved from -17.6% to -15.5%. Most of the improvement came from trend filtering, cross-asset diversification and inverse-volatility allocation. Reversal contributed only a small part.
That is more informative than calling it a “15.6% reversal strategy.” The original inspiration was not forced into the answer. When the data did not support it as the main driver, it became a supporting factor.
The agent also tested 162 nearby parameter and cost combinations. Among the 81 Top3 combinations, annualized returns mostly ranged from 14.3% to 15.9%, with Sharpe ratios from 1.06 to 1.17. The result was not attractive at only one isolated parameter setting.
05 Examine target allocations
An equity curve alone does not explain how a strategy would be implemented. The final report also calculated formal signals at the historical reference date of September 18, 2026.
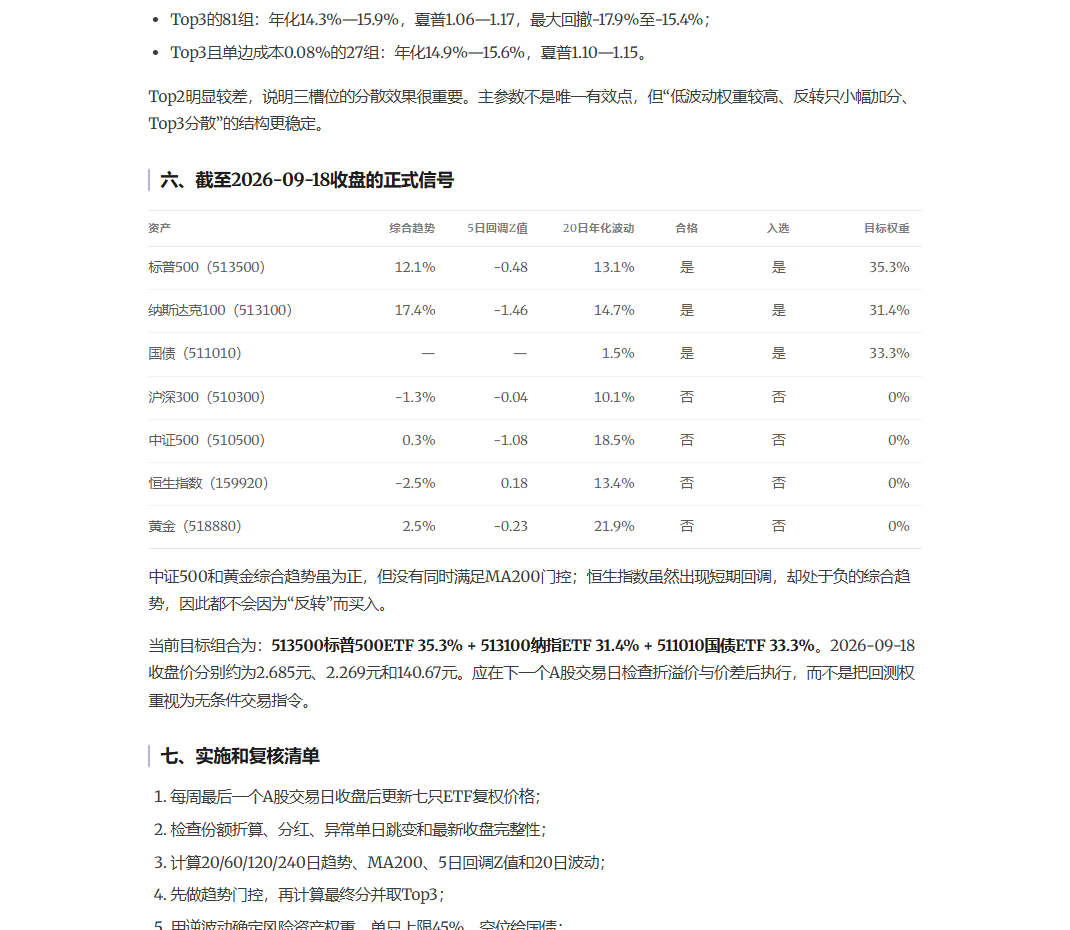
The CSI 500 and gold had positive composite trends but were not above MA200. The Hang Seng Index had pulled back in the short term, but its medium- and long-term trend was still negative. A reversal alone was not enough to qualify.
This illustrates the difference between the two versions. Reversal can affect ranking, but cannot override the trend gate. After calculating allocations, the report also called for checking QDII premiums or discounts, bid-ask spreads and subscription availability before execution. Target weights still require a human implementation review.
The full delivery included backtest code, equity series, trade records, subperiod results, parameter sensitivity and a data catalog. Changing assets, moving to monthly rebalancing or limiting US equity concentration can build on these files rather than starting again from a chat transcript.
06 Continue the research
The interaction was simple. The first sentence got the idea running; the second explained what the initial version did poorly. The agent then continued gathering data, testing and revising the rules.
Build a multi-asset rotation strategy with weekly rebalancing, using assets accessible through mainland China-listed ETFs.

My starting idea is to use short-term reversal to find opportunities. First turn it into explicit rules and backtest it against benchmarks such as equal weight and pure momentum. After the first version, do not rush to tune parameters. Identify where the returns and low volatility come from, then revise the strategy based on the weaknesses you find.
The original conversation includes the first version, the user's follow-up and the revision. The results page contains the full rules, charts, signals and risk discussion.